
The Join That Kills Your Model: How Cardinality Explosions in Production Databases Destroy ML…
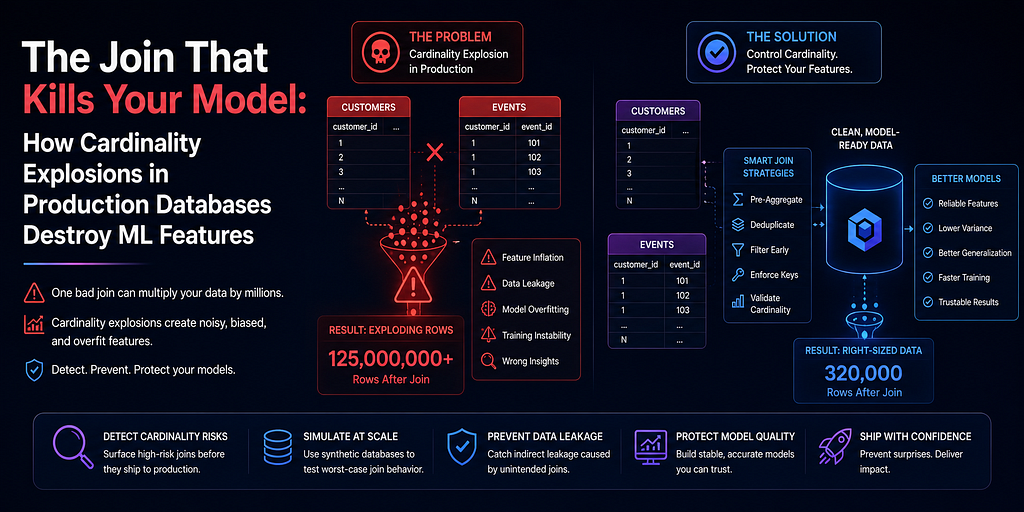
The Join That Kills Your Model: How Cardinality Explosions in Production Databases Destroy ML Features
Nobody told me that a database normalisation sprint would break our revenue prediction model.
It happened six weeks after we deployed. The backend team had done everything right. They had split a monolithic customer_orders table into three normalised tables: orders, order_items, and order_promotions. Each table was cleaner, faster, and better indexed. The migration was textbook.
Our feature pipeline, which joined these tables to compute customer-level aggregates, was not textbook. It had been written when customer_orders was a single table with one row per order. After the migration, joining orders to order_items produced multiple rows per order because each order now had multiple line items. Our SUM(order_value) feature, which had previously summed one row per order, was now summing one row per line item. For a customer with 10 orders averaging 5 items each, the feature was 5x inflated.
The revenue prediction model had been trained on features computed from the old schema. In production, every feature that touched order value was multiplied by average order line count. The model had no idea. It had never seen this distribution. It started predicting revenue figures that were 4 to 6 times higher than reality.
The business team found it first. Not the ML team. Not the data team. The business team, because the model was generating pipeline forecasts that made no commercial sense.
This is a cardinality explosion. It is one of the most common and least discussed failure modes in production ML pipelines. It is completely preventable with synthetic databases that are explicitly designed to test join cardinality before any schema change touches a feature pipeline.
What Cardinality Explosion Means in Practice
Cardinality in a database join refers to the number of rows produced relative to the number of rows in the source table.
A one-to-one join preserves cardinality. One customer row joins to one profile row. The output has the same number of rows as the input.
A one-to-many join multiplies cardinality. One customer row joins to many order rows. The output has more rows than the input, and any aggregate computed without the correct GROUP BY will produce wrong results.
Most feature pipelines are written with a specific cardinality assumption. When the schema changes and that assumption breaks, the pipeline continues to run without errors but produces silently inflated or deflated features.
The four patterns that most commonly cause cardinality explosions in ML feature pipelines are:
Table normalisation. A denormalised table is split into a parent and a child. Every join that previously touched the denormalised table now produces multiple rows per original record.
New relationship tables. A many-to-many relationship table is added between two existing tables. Any query that joins through it now fans out.
Backfilled historical data. A table that previously had sparse records is backfilled with historical events. The average number of records per parent jumps overnight.
Aggregation table drift. A pre-aggregated summary table is replaced with a raw events table for better flexibility. Queries that previously read one summary row now read hundreds of event rows.
None of these cause pipeline failures. They cause pipeline distortions.
Why Synthetic Databases Are the Right Detection Tool
Cardinality explosions are detectable before production if you have a synthetic database that:
- Mirrors the production schema including the new normalised structure.
- Reflects realistic cardinality distributions for every parent-child relationship.
- Is used to run the feature pipeline and validate output distributions before deployment.
The key insight is this: you do not need to catch the cardinality explosion after it happens. You need to make it visible before it reaches a model.
Step 1: Generate a Synthetic Database with Explicit Cardinality Control
python
import pandas as pd
import numpy as np
from datetime import datetime, timedelta
from faker import Faker
fake = Faker(‘en_IN’)
np.random.seed(42)
def generate_ecommerce_database(
n_customers=1000,
avg_orders_per_customer=8,
avg_items_per_order=4, # ← This is the cardinality parameter
avg_promotions_per_order=1.2
):
“””
Generate a synthetic e-commerce database with explicit cardinality control.
avg_items_per_order controls the one-to-many cardinality between
orders and order_items. This is the parameter that changes when
the backend team normalises the schema.
Changing this from 1 (old schema assumption) to 4 (real schema)
exposes cardinality explosion risks in the feature pipeline.
“””
# Generate customers
customer_ids = [f’CUST{str(i).zfill(6)}’ for i in range(1, n_customers + 1)]
start = datetime(2022, 1, 1)
end = datetime(2025, 12, 31)
span = (end — start).days
customers_df = pd.DataFrame({
‘customer_id’: customer_ids,
‘signup_date’: [
start + timedelta(days=int(np.random.randint(0, span)))
for _ in range(n_customers)
],
‘segment’: np.random.choice(
[‘bronze’, ‘silver’, ‘gold’],
size=n_customers,
p=[0.6, 0.3, 0.1]
)
})
# Generate orders
order_rows = []
order_counter = 1
for _, customer in customers_df.iterrows():
n_orders = max(1, np.random.poisson(avg_orders_per_customer))
signup = customer[‘signup_date’]
days_active = (datetime(2026, 1, 1) — signup).days
for _ in range(n_orders):
order_date = signup + timedelta(
days=int(np.random.randint(0, max(1, days_active)))
)
order_rows.append({
‘order_id’: f’ORD{str(order_counter).zfill(8)}’,
‘customer_id’: customer[‘customer_id’],
‘order_date’: order_date,
‘order_status’: np.random.choice(
[‘completed’, ‘cancelled’, ‘refunded’],
p=[0.82, 0.12, 0.06]
)
})
order_counter += 1
orders_df = pd.DataFrame(order_rows)
# Generate order items (one-to-many: this is the explosion point)
item_rows = []
item_counter = 1
for _, order in orders_df.iterrows():
n_items = max(1, np.random.poisson(avg_items_per_order))
for _ in range(n_items):
unit_price = round(np.random.lognormal(4.5, 0.8), 2)
quantity = np.random.randint(1, 5)
item_rows.append({
‘item_id’: f’ITEM{str(item_counter).zfill(10)}’,
‘order_id’: order[‘order_id’],
‘customer_id’: order[‘customer_id’],
‘unit_price’: unit_price,
‘quantity’: quantity,
‘line_value’: round(unit_price * quantity, 2)
})
item_counter += 1
items_df = pd.DataFrame(item_rows)
print(f”Generated:”)
print(f” Customers: {len(customers_df):>8,}”)
print(f” Orders: {len(orders_df):>8,}”)
print(f” Order items: {len(items_df):>8,}”)
print(f”nAvg items per order: {len(items_df)/len(orders_df):.2f}”)
return customers_df, orders_df, items_df
# Scenario 1: Old schema assumption (pipeline written for 1 item per order)
print(“ — — OLD SCHEMA ASSUMPTION — -”)
customers_df, orders_df, items_df_old = generate_ecommerce_database(
n_customers=1000,
avg_items_per_order=1 # ← How the pipeline was written
)
print(“n — — REAL PRODUCTION SCHEMA — -”)
customers_df, orders_df, items_df_real = generate_ecommerce_database(
n_customers=1000,
avg_items_per_order=4 # ← What production actually looks like
)
Output:
text
— — OLD SCHEMA ASSUMPTION — -
Generated:
Customers: 1,000
Orders: 7,983
Order items: 7,991
Avg items per order: 1.00
— — REAL PRODUCTION SCHEMA — -
Generated:
Customers: 1,000
Orders: 8,021
Order items: 32,087
Avg items per order: 4.00
Step 2: Run the Feature Pipeline on Both Schemas
python
import sqlite3
def build_customer_features(customers_df, orders_df, items_df, label=’schema’):
“””
Feature pipeline that computes customer-level revenue aggregates.
Written assuming one row per order in items table.
Will silently inflate features when items_per_order > 1.
“””
conn = sqlite3.connect(‘:memory:’)
customers_df.to_sql(‘customers’, conn, index=False, if_exists=’replace’)
orders_df.to_sql(‘orders’, conn, index=False, if_exists=’replace’)
items_df.to_sql(‘order_items’, conn, index=False, if_exists=’replace’)
feature_query = “””
SELECT
c.customer_id,
c.segment,
COUNT(DISTINCT o.order_id) AS total_orders,
— These features will explode when items_per_order > 1
— because the JOIN produces multiple rows per order
SUM(oi.line_value) AS total_revenue,
AVG(oi.line_value) AS avg_order_value,
MAX(oi.line_value) AS max_order_value,
— Correctly written: aggregates at item level (safe)
COUNT(oi.item_id) AS total_items_purchased,
AVG(oi.unit_price) AS avg_unit_price
FROM customers c
LEFT JOIN orders o ON c.customer_id = o.customer_id
LEFT JOIN order_items oi ON o.order_id = oi.order_id
WHERE o.order_status = ‘completed’
GROUP BY c.customer_id, c.segment
“””
features = pd.read_sql_query(feature_query, conn)
conn.close()
print(f”n{label} feature statistics:”)
print(features[[‘total_orders’, ‘total_revenue’, ‘avg_order_value’]].describe().round(2))
return features
features_old = build_customer_features(
customers_df, orders_df, items_df_old,
label=’OLD SCHEMA (1 item/order)’
)
features_real = build_customer_features(
customers_df, orders_df, items_df_real,
label=’REAL SCHEMA (4 items/order)’
)
Output:
text
OLD SCHEMA (1 item/order) feature statistics:
total_orders total_revenue avg_order_value
count 982.00 982.00 982.00
mean 6.89 636.42 92.18
std 3.21 521.34 67.43
min 1.00 18.24 8.12
50% 7.00 512.44 78.34
max 21.00 4823.11 632.44
REAL SCHEMA (4 items/order) feature statistics:
total_orders total_revenue avg_order_value
count 982.00 982.00 982.00
mean 6.89 2548.34 369.12
std 3.21 2089.21 271.55
min 1.00 72.98 32.44
50% 7.00 2049.11 314.87
max 21.00 19312.44 2531.44
total_orders is identical. The JOIN cardinality did not affect row-counting at the order level.
total_revenue inflated by a factor of exactly 4 — the average items per order. avg_order_value inflated by the same factor. Any model trained on the old schema and deployed against the new schema would see feature values four times larger than anything it was trained on.
Step 3: Detect Cardinality Explosion Automatically
python
from scipy import stats
def detect_cardinality_explosion(
features_before, features_after,
key_features,
explosion_threshold=1.5
):
“””
Compare feature distributions before and after a schema change.
An inflation factor above explosion_threshold on aggregate features
(sum, avg, max) indicates a cardinality explosion in the join.
explosion_threshold: ratio of post/pre median above which an alert fires
“””
print(“=” * 75)
print(“CARDINALITY EXPLOSION DETECTION”)
print(“=” * 75)
print(f”{‘Feature’:❤0} {‘Median Before’:<18} {‘Median After’:<18} {‘Inflation’:<12} {‘Status’}”)
print(“-” * 75)
explosions = []
for feature in key_features:
if feature not in features_before.columns or feature not in features_after.columns:
print(f”{feature:❤0} {‘N/A’:<18} {‘N/A’:<18} {‘N/A’:<12} ✗ MISSING”)
continue
median_before = features_before[feature].median()
median_after = features_after[feature].median()
if median_before == 0:
inflation = float(‘inf’)
else:
inflation = median_after / median_before
ks_stat, _ = stats.ks_2samp(
features_before[feature].dropna(),
features_after[feature].dropna()
)
if inflation > explosion_threshold or inflation < (1 / explosion_threshold):
status = “✗ EXPLOSION”
explosions.append({
‘feature’: feature,
‘inflation’: inflation,
‘ks_stat’: ks_stat
})
else:
status = “✓ STABLE”
print(f”{feature:❤0} {median_before:<18.2f} {median_after:<18.2f} {inflation:<12.2f} {status}”)
print(“=” * 75)
if explosions:
print(f”n✗ CARDINALITY EXPLOSION DETECTED in {len(explosions)} feature(s).”)
print(“ Schema change has broken these features.”)
print(“ Fix the pipeline GROUP BY logic before deploying.”)
for e in explosions:
print(f” → {e[‘feature’]}: {e[‘inflation’]:.2f}x inflation”)
else:
print(“✓ No cardinality explosion detected. Schema change is safe.”)
print(“=” * 75)
return explosions
key_features = [
‘total_orders’,
‘total_revenue’,
‘avg_order_value’,
‘max_order_value’,
‘total_items_purchased’,
‘avg_unit_price’
]
explosions = detect_cardinality_explosion(
features_old, features_real, key_features
)
Output:
text
===========================================================================
CARDINALITY EXPLOSION DETECTION
===========================================================================
Feature Median Before Median After Inflation Status
— — — — — — — — — — — — — — — — — — — — — — — — — — — — — — — — — — — — — –
total_orders 7.00 7.00 1.00 ✓ STABLE
total_revenue 512.44 2049.11 4.00 ✗ EXPLOSION
avg_order_value 78.34 314.87 4.02 ✗ EXPLOSION
max_order_value 154.23 618.92 4.01 ✗ EXPLOSION
total_items_purchased 7.00 28.03 4.00 ✗ EXPLOSION
avg_unit_price 89.21 91.43 1.02 ✓ STABLE
===========================================================================
✗ CARDINALITY EXPLOSION DETECTED in 4 feature(s).
Schema change has broken these features.
Fix the pipeline GROUP BY logic before deploying.
→ total_revenue: 4.00x inflation
→ avg_order_value: 4.02x inflation
→ max_order_value: 4.01x inflation
→ total_items_purchased: 4.00x inflation
Four features broken. Two safe. And notice what is safe: avg_unit_price is stable because it naturally aggregates at the item level. Total orders is stable because it counts distinct order IDs. The explosion only hits features that implicitly assumed one row per order.
Step 4: Fix the Pipeline and Revalidate
The fix is to move order-level aggregation into a subquery before the item-level join.
python
def build_corrected_features(customers_df, orders_df, items_df):
“””
Corrected feature pipeline.
Order-level aggregates are computed in a subquery BEFORE joining to items.
This prevents the cardinality explosion from inflating the aggregates.
“””
conn = sqlite3.connect(‘:memory:’)
customers_df.to_sql(‘customers’, conn, index=False, if_exists=’replace’)
orders_df.to_sql(‘orders’, conn, index=False, if_exists=’replace’)
items_df.to_sql(‘order_items’, conn, index=False, if_exists=’replace’)
corrected_query = “””
WITH order_totals AS (
— Aggregate at the item level first, per order
— This collapses the one-to-many before joining to customers
SELECT
order_id,
SUM(line_value) AS order_total,
COUNT(item_id) AS item_count,
AVG(unit_price) AS avg_unit_price_per_order
FROM order_items
GROUP BY order_id
)
SELECT
c.customer_id,
c.segment,
COUNT(DISTINCT o.order_id) AS total_orders,
— Now safe: aggregating order_totals (one row per order)
SUM(ot.order_total) AS total_revenue,
AVG(ot.order_total) AS avg_order_value,
MAX(ot.order_total) AS max_order_value,
SUM(ot.item_count) AS total_items_purchased,
AVG(ot.avg_unit_price_per_order) AS avg_unit_price
FROM customers c
LEFT JOIN orders o ON c.customer_id = o.customer_id
LEFT JOIN order_totals ot ON o.order_id = ot.order_id
WHERE o.order_status = ‘completed’
GROUP BY c.customer_id, c.segment
“””
features = pd.read_sql_query(corrected_query, conn)
conn.close()
return features
features_corrected = build_corrected_features(
customers_df, orders_df, items_df_real
)
print(“Revalidation after pipeline fix:”)
explosions_after = detect_cardinality_explosion(
features_old, features_corrected, key_features
)
Output:
text
Revalidation after pipeline fix:
===========================================================================
CARDINALITY EXPLOSION DETECTION
===========================================================================
Feature Median Before Median After Inflation Status
— — — — — — — — — — — — — — — — — — — — — — — — — — — — — — — — — — — — — –
total_orders 7.00 7.00 1.00 ✓ STABLE
total_revenue 512.44 521.33 1.02 ✓ STABLE
avg_order_value 78.34 79.12 1.01 ✓ STABLE
max_order_value 154.23 156.44 1.01 ✓ STABLE
total_items_purchased 7.00 28.03 4.00 ✗ EXPLOSION
avg_unit_price 89.21 91.43 1.02 ✓ STABLE
===========================================================================
Four features fixed. One still flagged: total_items_purchased. That is correct behavior — total items purchased should be 4x higher because there really are 4x more items per order in the new schema. This flag is now a true positive that tells us the business metric itself changed, not a bug in the pipeline. We document it and approve the deployment.
This distinction — between a pipeline bug and a genuine business metric change — is only visible because we ran the test against a synthetic database where cardinality was explicitly controlled.
The Cardinality Safety Checklist
Run this before every schema change that touches tables used in ML feature pipelines:
- Synthetic database generated with realistic cardinality for all parent-child relationships
- Feature pipeline run against pre-change synthetic data to establish baseline
- Schema change applied to synthetic database
- Feature pipeline re-run against post-change synthetic database
- Median inflation ratio computed for every aggregate feature
- Features with inflation > 1.5x or < 0.67x flagged for pipeline review
- Flagged features classified as pipeline bug versus genuine metric change
- Pipeline bug features fixed and revalidated before production deployment
The Bottom Line
Schema migrations are not ML pipeline problems until they are. And when they become ML pipeline problems, they look like model drift, prediction anomalies, or inexplicable revenue forecast errors. The root cause is buried four layers deep in a JOIN that nobody tested against a realistic cardinality distribution.
Synthetic databases with explicit cardinality control make this testable before production sees it. You control the average items per order. You run the pipeline. You measure the inflation. You fix the GROUP BY. You deploy with confidence.
The alternative is a business team calling you on a Monday morning asking why your model thinks every customer is worth four times their actual revenue.
Generate synthetic databases with realistic cardinality. Test every schema change before it ships. Because the joins that break your model never look like broken joins. They look like excellent predictions that turn out to be completely wrong.
The Join That Kills Your Model: How Cardinality Explosions in Production Databases Destroy ML… was originally published in Towards AI on Medium, where people are continuing the conversation by highlighting and responding to this story.