
The Day I Let an AI Agent Build My Power BI Report — And What It Got Wrong
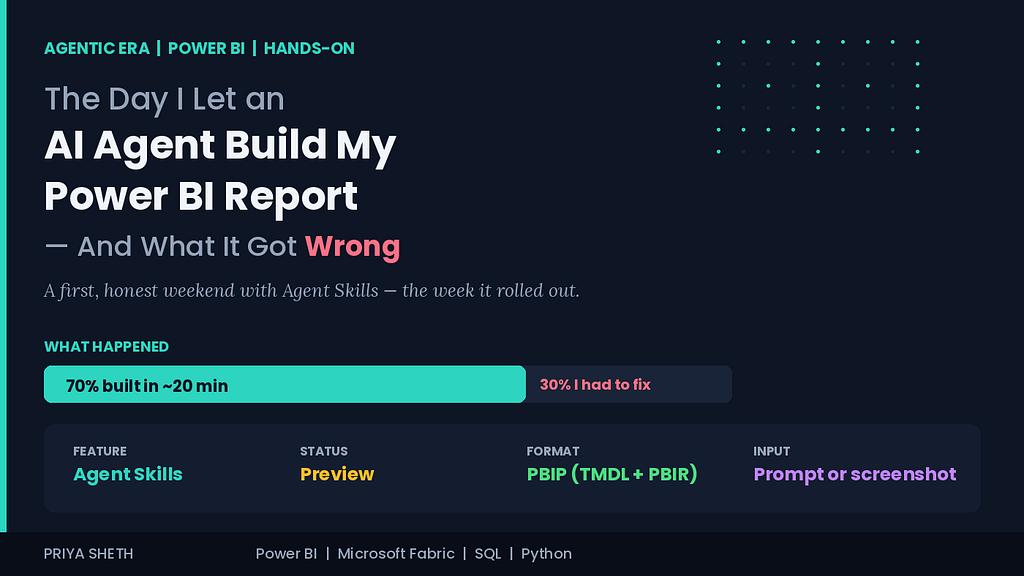
Agent Skills for Power BI rolled out this week. I spent a weekend handing it a real report to build — and watching, with my old designer’s eye, exactly where it succeeded and where it quietly fell apart.
I need to be upfront about something before you read another word: I have not been using this for months. Nobody has. Agent Skills for Power BI was announced at Microsoft Build 2026 and, according to Microsoft’s own blog, started rolling out only days ago. So this isn’t a battle-tested “here’s how I shipped twelve production reports with AI” piece. Those will come, and you should be suspicious of anyone publishing one this week.
This is something smaller and, I think, more honest: a record of the first weekend I spent actually using it. What it got right. What it got wrong. And what my old UI/UX brain noticed that my analyst brain might have missed.
Let me set the scene. It’s Saturday morning. I have coffee, a Power BI Project I’d been meaning to rebuild, and a screenshot of an old report that a stakeholder had once described — to my face — as “busy.” I decided to find out whether an AI agent could do in an afternoon what would normally take me the better part of two days.
The short version: it did about 70% of the work in 20 minutes, and then I spent the rest of the afternoon fixing the 30% that was wrong in ways that mattered.
Here’s the long version.
First, What Agent Skills Actually Is (Without the Hype)
There’s a lot of confused writing about this already, so let me be precise about what was announced and what it actually does.
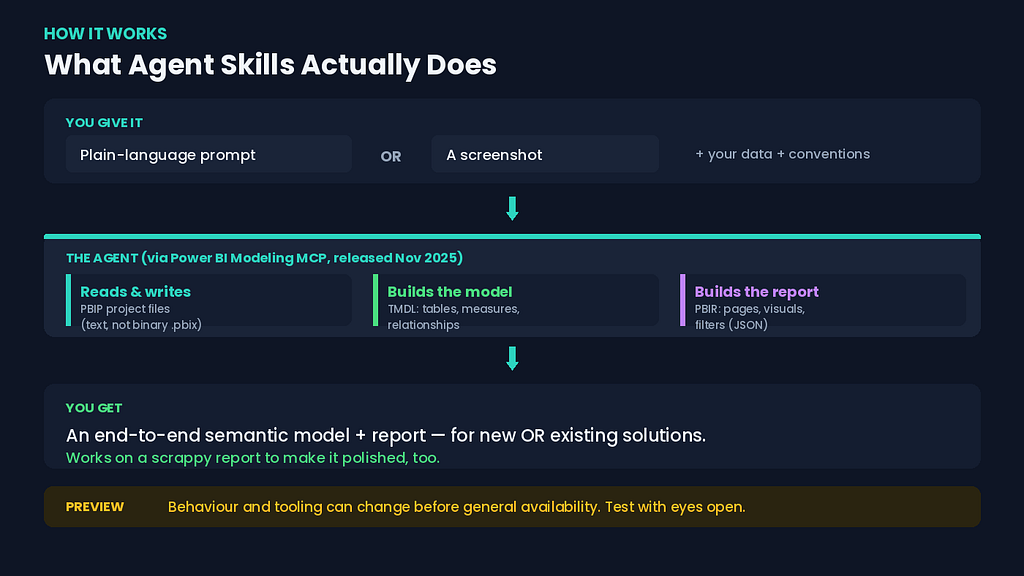
Back in November 2025, Microsoft released the Power BI Modeling MCP — a Model Context Protocol server that let AI agents interact with Power BI’s semantic layer. If you’ve used any coding agent with an MCP connection, you know the pattern: the agent gets a set of tools it can call to read and modify something. The Modeling MCP gave agents tools to author semantic models.
Agent Skills for Power BI, announced at Build 2026, extends that idea from just the model to the whole solution — semantic model and report — using Power BI Projects (PBIP). If you’ve never worked with PBIP, here’s the one thing to know: it’s the source-control-friendly format that decomposes a Power BI file into human-readable text. The semantic model becomes TMDL files (tables, columns, measures, relationships). The report becomes PBIR files (pages, visuals, filters), stored as JSON.
Because the whole thing is now text files instead of a binary .pbix, an AI agent can read it, reason about it, and edit it the same way it edits any codebase. That’s the unlock. You describe what you want — in plain language, or even from a screenshot — and the agent constructs the semantic model from your Fabric data, generates report pages, and iterates on the visuals.
Two things I want to flag immediately, because they’re easy to miss in the announcement excitement:
It’s a preview. Microsoft labels it as such, plainly. Preview means the behaviour, and possibly the syntax and tooling, can change before general availability. I’m testing it with eyes open, not deploying it to anything that matters.
It’s a coding-agent workflow, not a button in Power BI Desktop. This is the part most analysts will trip over. Agent Skills isn’t the Copilot pane you click inside Power BI Desktop. It lives in the coding-agent world — you’re working with PBIP project files, an agent, and an MCP connection. If the words “VS Code,” “terminal,” and “project files” make you nervous, this is going to feel unfamiliar at first.
That second point is, honestly, where my background gave me an unfair advantage. Before I was a data analyst, I built websites. WordPress, custom themes, a lot of time spent in code editors and the command line. So when the recommended workflow turned out to be “open your PBIP in a coding agent and prompt it,” I wasn’t intimidated. A lot of analysts will be, and I don’t think that’s a personal failing — it’s a genuine shift in what the job looks like.
The Setup, and the First Honest Surprise
I won’t give you a step-by-step click-path, for one simple reason: the feature rolled out this week, and the exact setup steps are still settling. Anything I wrote down today might be wrong by the time you read it. I’d rather under-promise on specifics than hand you instructions that break.
What I can describe is the shape of the workflow, which is well documented and stable in concept:
- You have your Power BI solution in PBIP format — either a new empty project or an existing one.
- You connect a coding agent to the relevant MCP tooling so it can read and write the project’s TMDL and PBIR files.
- You give the agent context — what your data looks like, what conventions you follow, what the report is for. The community has converged on curating this context in instruction files (you’ll see references to AGENTS.md and similar). This is not a one-time setup. It’s ongoing curation.
- You prompt. Or you hand it a screenshot. And it goes to work.
Here’s the first honest surprise: the quality of what came back was directly proportional to the quality of the context I gave it. When I prompted lazily — “build me a sales report from this data” — I got something generic and structurally confused. When I invested fifteen minutes describing my data, my naming conventions, and the actual question the report needed to answer, the output got dramatically better.
This shouldn’t have surprised me. It’s exactly the same lesson from the Figma sketching habit I wrote about recently — the work you do before you build determines the quality of what gets built. The agent didn’t remove that work. It relocated it. Instead of spending two hours building, I spent fifteen minutes specifying and then forty minutes reviewing. The thinking didn’t go away. It moved to the front.
What the Agent Got Right (And It Was Genuinely Impressive)
I want to give credit honestly, because some of what happened was the kind of thing that makes you sit back in your chair.
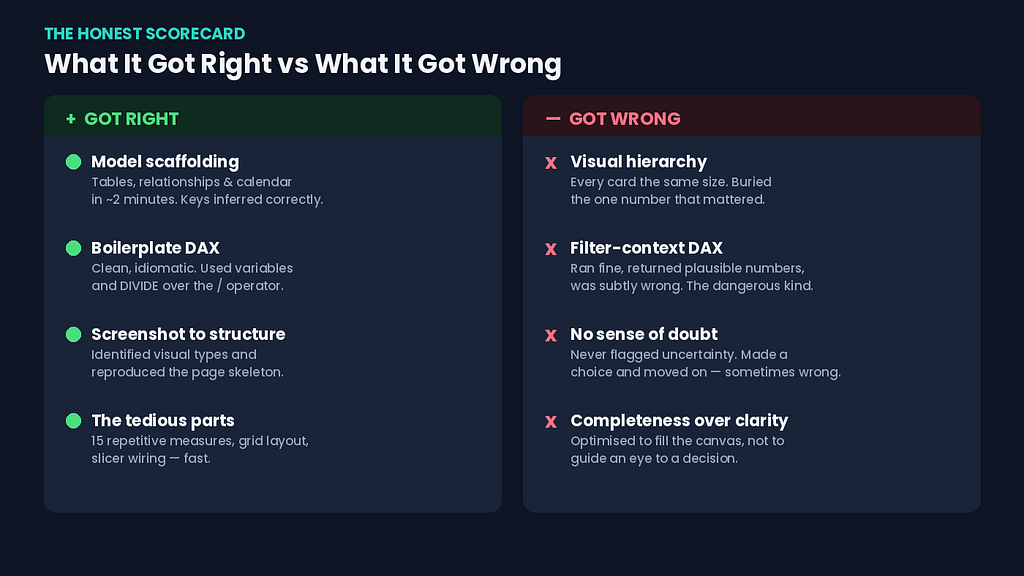
The semantic model scaffolding was fast and mostly correct. I pointed it at a Fabric lakehouse table and asked it to build a starter model. Within a couple of minutes it had created the tables, inferred relationships from the column names and keys, and generated a calendar table. The relationships it inferred were the obvious ones — fact to dimension on the surrogate keys — and they were right. For a model I’d otherwise be clicking together by hand, this was a real time-saver.
The boilerplate DAX was clean. Asked for the standard measures — total revenue, distinct customer count, a year-over-year comparison — it produced DAX that was not just functional but reasonably idiomatic. It used variables. It used DIVIDE instead of the / operator for the ratio measures, which protects against divide-by-zero. Small thing. The kind of small thing a junior analyst forgets and a careful one doesn’t. The agent didn’t forget.
Generating from a screenshot actually worked. This is the headline feature, and I was skeptical. I handed it a screenshot of an old report layout and asked it to reproduce the structure. It identified the visual types — the card row across the top, the trend line, the category breakdown bar chart — and generated a report page with the same skeleton. Not pixel-perfect. But structurally faithful enough that I could see what it was doing and why.
It was genuinely fast at the tedious parts. The work that Agent Skills compressed most dramatically wasn’t the clever work — it was the boring work. Creating fifteen measures that follow the same pattern. Laying out a page grid. Wiring slicers to the right fields. The stuff that isn’t hard, just slow. That’s where the 20-minutes-instead-of-two-hours came from.
If the story ended here, this would be a breathless “AI changes everything” post. It doesn’t end here.
What the Agent Got Wrong (And Why My Designer Brain Caught It)
Here’s where it gets interesting, and where I think my specific background mattered.
The layout was technically correct and humanly wrong. The agent reproduced my screenshot’s structure faithfully — which was the problem, because the original report was the “busy” one a stakeholder had complained about. When I instead asked it to build a layout from scratch for a stated question, it produced something that violated almost every visual-hierarchy principle I care about. Every card was the same size. The most important number — the one the whole report existed to answer — had no more visual weight than a secondary metric. It had filled the canvas efficiently, the way you’d pack boxes into a truck. But a report isn’t a truck. The point isn’t to use the space. The point is to guide an eye to a decision.
The agent optimised for completeness and coverage. It put everything on the page, neatly. What it could not do was make the judgment call that a human stakeholder makes in the first ten seconds: what is the one thing I’m supposed to look at first? That judgment — the decision about what deserves to be big and what deserves to be small — is still mine. The agent gave me a tidy grid. It could not give me a point of view.
Some of the DAX looked right and wasn’t. This is the dangerous category, and it’s the one I’d warn every analyst about most loudly. The simple measures were fine. But when I asked for something involving filter context — a measure that needed to respect a specific segment while ignoring another filter — the agent produced DAX that ran, returned plausible numbers, and was subtly wrong. It had used the wrong context-modification pattern. The output looked completely reasonable. If I hadn’t checked it against a number I already knew, I’d have shipped it.
This matches what the DAX experts at SQLBI flagged when agentic development for Power BI first emerged: agents working on semantic-model metadata have a real tendency to make mistakes, partly because this kind of content is sparse in their training data and partly because Power BI models are genuinely complex. The agent is a confident writer. Confidence and correctness are not the same thing — which, if you read my last few articles, you’ll know is a drum I can’t stop banging.
To make this concrete without misrepresenting exactly what the agent produced, let me show you the shape of the mistake. Say you want “revenue for the Premium segment, regardless of any segment filter the user has applied.” The intent is to override the segment filter. A pattern that looks right but isn’t might do this:
Premium Revenue =
CALCULATE(
    [Total Revenue],
    DimCustomer[Segment] = "Premium"
)
That reads cleanly. It returns a number. But CALCULATE with a simple filter predicate replaces the filter on that column — which is usually what you want, until it interacts with a slicer or a visual-level filter on the same column in a way you didn’t intend, and the number quietly shifts depending on report context. If what you actually need is to ignore the existing segment filter entirely and then apply your own, the more defensive pattern is explicit:
Premium Revenue =
CALCULATE(
    [Total Revenue],
    KEEPFILTERS(DimCustomer[Segment] = "Premium")
)
-- or, when you truly want to ignore existing context:
Premium Revenue =
CALCULATE(
    [Total Revenue],
    REMOVEFILTERS(DimCustomer[Segment]),
    DimCustomer[Segment] = "Premium"
)
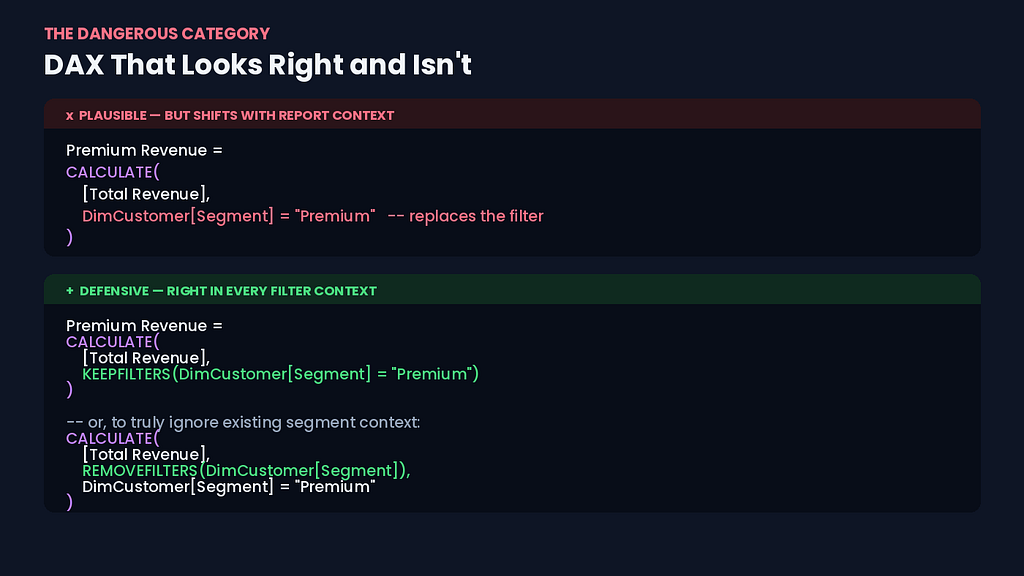
The difference between these is the difference between a number that’s right in isolation and a number that’s right in every filter context a user can create. The agent reached for the first shape. It took me checking against a figure I already knew to notice the gap. None of these threw an error. All of them returned plausible numbers. Only one of them was the number I actually meant.
It didn’t know what it didn’t know. When the agent was uncertain, it didn’t flag uncertainty. It just produced something. There was no “I’m not sure about this relationship, can you confirm the grain of this table?” — the kind of question a thoughtful junior analyst would ask. It made a choice and moved on, and the choice was sometimes wrong in a way that was invisible unless you went looking. The burden of doubt stayed entirely with me.
The Pattern: It Automates the Building, Not the Judgment
After a full afternoon, here’s the mental model I landed on.
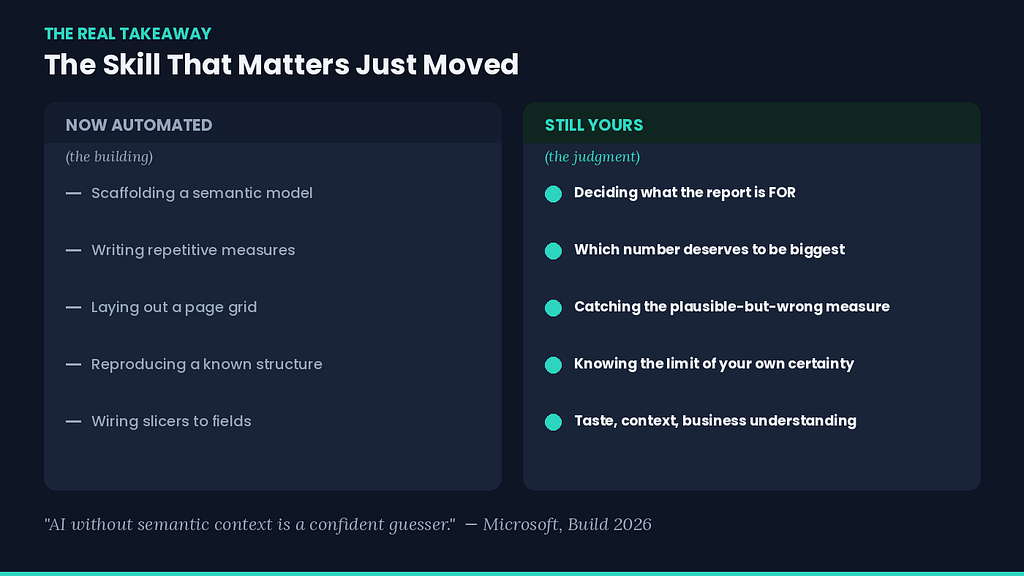
Agent Skills is extraordinarily good at the parts of report-building that are mechanical: scaffolding a model, writing repetitive measures, laying out a grid, reproducing a known structure. These are the parts that consume the most time and the least thought. Compressing them is a real, material productivity gain. I’m not going to pretend otherwise — the 20-minutes-versus-two-hours was real.
What it cannot do — at least not in this preview, at least not yet — is the parts that are judgment:
- Deciding what the report is actually for, and what single question it must answer.
- Deciding which number deserves to be the largest thing on the page.
- Knowing when a measure that returns a plausible number is returning the wrong plausible number.
- Recognising the boundary of its own competence and asking a question instead of guessing.
Microsoft’s own framing of this whole agentic push actually says this part out loud, and I think it’s the most honest sentence in the entire announcement: AI without semantic context is a confident guesser. The reason the semantic model matters so much in this new world is that the model is where human judgment gets encoded — the measures, the relationships, the definitions that say this is how our business actually works. The better that foundation, the less the agent has to guess. But the foundation is still built by a person who understands the business. The agent builds faster on top of good judgment. It does not supply the judgment.
So Where Does This Leave Analysts Like Me?
I’ll be honest that I felt two things over that weekend, in this order.
The first was a flicker of the fear that I think every analyst is feeling right now and most aren’t saying out loud: is this the thing that makes my job disappear? Watching it scaffold a model in two minutes that would’ve taken me an hour, that fear is not irrational.
The second feeling, which arrived after I’d spent the afternoon fixing what it got wrong, was steadier: the skill that matters just moved. For years, a big part of my value was knowing how to build — how to write the DAX, wire the relationships, lay out the visuals. The building is being automated. What’s left, and what’s becoming more valuable, is the judgment: knowing what to build, knowing when the output is wrong, knowing what deserves attention and what doesn’t.
That’s not a comfortable shift, but it’s not a hopeless one either. It rewards exactly the things that are hardest to automate — taste, business understanding, the ability to look at a confident wrong answer and feel the wrongness before you can even articulate it. If anything, my detour through design turned out to be the most future-proof thing on my CV, which is not a sentence I expected to write three years ago.
If you take one practical thing from this: start practising review, not just construction. The analyst who thrives in this next phase isn’t the one who can build the fastest. It’s the one who can look at something an agent built and reliably catch the measure that’s subtly wrong, the layout that buries the answer, the relationship that’ll silently inflate a number three months from now. That’s a learnable skill. It’s also, conveniently, the same skill that makes you good without an agent.
My Honest Verdict, For Now
Would I use Agent Skills for Power BI again? Yes — for the right things, with my eyes open.
For scaffolding a new model, generating boilerplate measures, and getting a structural first draft of a report on the page, it’s a genuine accelerant. I’d reach for it the way I reach for autocomplete: useful, fast, and absolutely not to be trusted blindly.
For anything that touches real filter-context logic, anything going in front of a stakeholder who’ll make a decision on it, anything where a subtly wrong number has consequences — I’m reviewing every line. Not because the agent is bad, but because the failure mode is invisible plausibility, which is the most expensive kind of wrong there is.
And I’m holding the strong opinions loosely, because this is a preview that’s days old. The version that reaches general availability might close some of the gaps I hit this weekend. I’ll write the follow-up when it does — and I’ll be just as honest then about what changed and what didn’t.
For now: it builds fast, it guesses confidently, and it cannot yet tell the difference between a report that’s full and a report that’s clear. That difference is still my job. I’m oddly relieved about that.
The Day I Let an AI Agent Build My Power BI Report — And What It Got Wrong was originally published in Towards AI on Medium, where people are continuing the conversation by highlighting and responding to this story.