Manual Tracing, Scores, and Evaluation with Langfuse (Self-Hosted)

Table of Contents
- Manual Tracing, Scores, and Evaluation with Langfuse (Self-Hosted)
- Why Manual Tracing Matters for LLM Observability
- Decorator vs Manual Tracing: When to Use Which
- Manual Tracing with the Langfuse Low-Level API
- Why Manual Tracing Matters (Even If You Use Decorators)
- Full Manual Tracing Implementation with Langfuse
- Code Walkthrough: Langfuse Manual Tracing Pipeline
- Creating Manual Traces in Langfuse
- Running the Langfuse Manual Tracing Script
- Viewing Manual Traces in the Langfuse Dashboard
- Manual vs Decorator Tracing in Langfuse
- Adding LLM Evaluation Metrics Beyond Manual Tracing
- Code Walkthrough: evaluation_metrics.py
- Running the LLM Evaluation Metrics Pipeline
- Conceptual Mockup: Evaluation Trace in Langfuse
- Real Trace from Our Self-Hosted Langfuse Dashboard
- Why LLM Evaluation Metrics Matter
- What the vLLM Health Check Script Validates
- Code Walkthrough: health_check.py
- Why vLLM Health Checks Matter for LLM Observability
Manual Tracing, Scores, and Evaluation with Langfuse (Self-Hosted)
In this lesson, you will learn how to take full control of LLM observability using the Langfuse manual tracing API. While Lesson 1 demonstrated the benefits of decorator-based tracing, real-world LLM systems often require deeper visibility. This includes custom spans, step-level metadata, evaluation scores, and multi-stage inspection for RAG pipelines and agent workflows.
In this lesson, you will build a fully instrumented pipeline where every step, every decision, and every model output is recorded with precision inside your self-hosted Langfuse dashboard.
This lesson is the 2nd in a 3-part series on LLM observability with Langfuse:
- LLM Observability with Self-Hosted Langfuse and vLLM
- Manual Tracing, Scores, and Evaluation with Langfuse (Self-Hosted) (this tutorial)
- Lesson 3
To learn how to build manual traces, attach custom spans, and evaluate LLM outputs with scoring metadata, just keep reading.

Why Manual Tracing Matters for LLM Observability
In Lesson 1, we built the foundations of LLM observability with a fully self-hosted Langfuse stack, a local vLLM server, and a complete decorator-based tracing pipeline. With just a few @observe decorators, we captured prompts, outputs, latency, token usage, and nested spans, all visualized instantly in the Langfuse dashboard. That approach was simple, powerful, and ideal for most LLM applications.
However, real production systems require more control than a decorator can provide.
Decorator-based tracing works well when function boundaries align with observability boundaries. Once a pipeline becomes dynamic, for example by involving multiple retrieval steps, conditional branches, tool calls, retries, validations, re-ranking, scoring, or multi-agent planning, you must explicitly decide what gets traced, how traces are grouped, and what metadata is recorded at each stage. In these scenarios, manual tracing becomes essential.
Manual tracing allows you to open and close spans at will, attach arbitrary metadata, log intermediate states, record evaluation scores, and capture execution steps that do not live inside a function, including loops, conditionals, streaming tokens, or retry logic. In short, decorator tracing provides automation, while manual tracing provides precision.
This lesson shows you how to construct traces explicitly, starting from creating the root trace and continuing through building child spans and attaching fine-grained metadata and custom evaluation signals. You will also integrate evaluation_metrics.py, which introduces lightweight scoring for model generations. This makes it possible to track correctness, response length, latency thresholds, or any domain-specific metric directly inside Langfuse as structured metadata.
By the end of this section, you will understand not only why manual tracing matters, but also when it becomes indispensable. Common use cases include debugging RAG pipelines, analyzing retrieval failures, tracking hallucination hotspots, validating agent actions, and building complex multi-step LLM systems where you need complete visibility into what happened and why.
If you are ready to take full control of your observability pipeline, including manual spans and rich evaluation metadata, the following sections will guide you through the process step by step.
Decorator vs Manual Tracing: When to Use Which
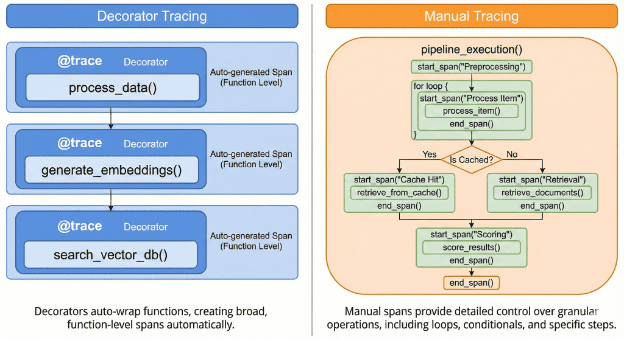
In Lesson 1, the @observe decorator gave us an elegant and almost magical tracing experience. You wrapped a function, ran your pipeline, and Langfuse automatically produced a structured trace with child spans, latency, token usage, and full metadata. This approach works well when your application is composed of clean, well-defined functions, such as a simple “generate answer” pipeline or a single LLM call with minimal branching.
However, decorators have an important limitation. They observe function boundaries, not logic boundaries.
If your real pipeline involves conditional flows, loops, retries, branching, retrieval, ranking, tool invocation, or agent-style decision-making, tracing only the outer function hides much of the interesting behavior. The decorator cannot see inside reasoning steps, iterative refinements, or internal calls unless those steps are wrapped in separate functions. As systems become more dynamic and non-linear, decorator-based tracing begins to fall short.
This is where manual tracing becomes essential.
Manual spans allow you to mark exactly where a step begins and ends, even when that step is not a function. You can record intermediate artifacts such as retrieved documents, scoring signals, latency thresholds, or model reasoning stages. You can attach custom metadata to any span and build a detailed step-by-step view of how your LLM pipeline behaves, rather than only seeing which functions were invoked.
In practice, the most effective approach is hybrid. Use decorators for high-level structure, and use manual spans when precision is required.
This lesson focuses on building that precision.
Would you like immediate access to 3,457 images curated and labeled with hand gestures to train, explore, and experiment with … for free? Head over to Roboflow and get a free account to grab these hand gesture images.
Need Help Configuring Your Development Environment?
All that said, are you:
- Short on time?
- Learning on your employer’s administratively locked system?
- Wanting to skip the hassle of fighting with the command line, package managers, and virtual environments?
- Ready to run the code immediately on your Windows, macOS, or Linux system?
Then join PyImageSearch University today!
Gain access to Jupyter Notebooks for this tutorial and other PyImageSearch guides pre-configured to run on Google Colab’s ecosystem right in your web browser! No installation required.
And best of all, these Jupyter Notebooks will run on Windows, macOS, and Linux!
Manual Tracing with the Langfuse Low-Level API
In Lesson 1, you used @observe decorators to add observability with almost no effort: just annotate your functions and Langfuse automatically created traces, spans, usage metadata, and latency metrics.
In this lesson, we take the opposite approach: full manual control.
Manual tracing exposes the entire underlying API used by Langfuse itself. You decide:
- when traces are created
- how spans relate to each other
- what metadata you attach
- how token usage is recorded
- how latencies are measured
- how deeply nested your pipeline becomes
This approach is critical for advanced LLM workflows where decorators are either too restrictive or too magical.
You will see exactly how Langfuse stores a trace internally, and why this skill becomes essential when building complex RAG, evaluation, or multi-agent systems.
Why Manual Tracing Matters (Even If You Use Decorators)
The decorator API is elegant but sometimes too simple.
Manual tracing is required when you need:
- Full control over trace structure: Define parent → child → subchild relationships explicitly.
- Dynamic spans: When you do not know upfront how many steps your pipeline will generate.
- Conditional traces: e.g., only log LLM calls above 2 seconds latency.
- Custom metadata injection: Dynamic context, retrieval sources, ranking scores, chain-of-thought summaries, etc.
- Advanced RAG + agent observability: Where each tool call needs explicit naming and structure.
In short:
The decorator API is the convenience layer.
Manual tracing is the power-user layer.
Full Manual Tracing Implementation with Langfuse
Below is your complete script, src/tracing_manual.py, unmodified and shown entirely so readers can reference it line-by-line.
"""
Manual Tracing with Low-Level Langfuse API

Shows explicit trace creation and management using Langfuse SDK directly.
This gives you full control but requires more code compared to decorators.
"""

from langfuse import Langfuse
from llm_utils import get_llm_client
from config import get_llm_config
import time

# Initialize Langfuse client
langfuse = Langfuse()

# Initialize vLLM client
client, model = get_llm_client(load_model_from_config=True)

# Get configuration
llm_config = get_llm_config()
temperature = llm_config.get("temperature", 0.7)
max_tokens = llm_config.get("max_tokens", 300)


def generate_with_manual_tracing(question: str) -> str:
    """
    Generate answer WITH manual trace creation.

    This gives you full control over every trace property:
    - Custom trace names and IDs
    - Granular span creation
    - Manual token counting
    - Custom metadata
    """

    print("Calling LLM with manual tracing...")

    # 1. Create trace manually
    trace = langfuse.trace(
        name="manual_llm_call",
        metadata={"method": "manual", "question": question}
    )

    # 2. Create span for LLM generation
    start_time = time.time()

    generation = trace.generation(
        name="llm_generation",
        model=model,
        input=[
            {"role": "system", "content": "You are a helpful assistant."},
            {"role": "user", "content": question}
        ],
        metadata={
            "temperature": temperature,
            "max_tokens": max_tokens
        }
    )

    # 3. Make the actual LLM call
    response = client.chat.completions.create(
        model=model,
        messages=[
            {"role": "system", "content": "You are a helpful assistant."},
            {"role": "user", "content": question}
        ],
        temperature=temperature,
        max_tokens=max_tokens
    )

    latency_ms = (time.time() - start_time) * 1000
    answer = response.choices[0].message.content

    # 4. Update generation with results
    generation.update(
        output=answer,
        usage={
            "input": response.usage.prompt_tokens,
            "output": response.usage.completion_tokens,
            "total": response.usage.total_tokens
        },
        metadata={
            "latency_ms": round(latency_ms, 2)
        }
    )

    print(f"   Tokens used: {response.usage.total_tokens}")
    print(f"   Latency: {latency_ms:.2f}ms")
    print(f"   ✅ Manually logged to Langfuse")
    print(f"   🔍 Trace ID: {trace.id}n")

    return answer


if __name__ == "__main__":
    print("n" + "="*70)
    print("Manual Tracing Demo")
    print("="*70 + "n")

    question = "What is deep learning?"
    print(f"Question: {question}n")
    print("-" * 70 + "n")

    # Generate with manual tracing
    answer = generate_with_manual_tracing(question)
    print(f"Answer: {answer}n")

    print("=" * 70)
    print("n📊 Manual Tracing vs Decorators:")
    print("   Manual (this file):")
    print("   • Full control over trace structure")
    print("   • More verbose code")
    print("   • Good for complex custom logging")
    print()
    print("   Decorators (recommended):")
    print("   • Clean @observe annotation")
    print("   • Less boilerplate")
    print("   • Automatic nesting")
    print("   • See: src/tracing_decorator.py")
    print("n🔍 Check your dashboard: https://cloud.langfuse.com")
    print("=" * 70 + "n")

    # Flush traces
    langfuse.flush()
Code Walkthrough: Langfuse Manual Tracing Pipeline
Let us break this down into meaningful building blocks.
Initializing Langfuse + vLLM
langfuse = Langfuse()
client, model = get_llm_client(load_model_from_config=True)
llm_config = get_llm_config()
Here, we:
- connect to the self-hosted
Langfuse Server - initialize a
vLLMOpenAI-compatible client - load generation parameters such as
temperatureandmax_tokens
Nothing happens yet. This is just configuration.
The real magic begins once we create a trace.
Important: Manual tracing gives you full control over the trace lifecycle.
Creating Manual Traces in Langfuse
trace = langfuse.trace(
    name="manual_llm_call",
    metadata={"method": "manual", "question": question}
)
A trace is the root object that represents the entire request.
You define:
tracenamemetadatacontext
This is equivalent to @observe(name="llm_pipeline"), but explicit.
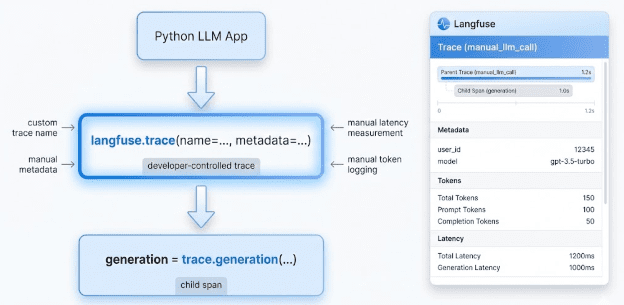
langfuse.trace(), giving you full control over naming, IDs, metadata, and context.Creating a Generation Span
generation = trace.generation(
    name="llm_generation",
    model=model,
    input=[ ... ],
    metadata={ ... }
)
This is the part decorators automatically create.
A generation span:
- represents a single LLM model call
- stores the prompt
- stores parameters (
temperature,max_tokens) - links itself as a child of the main trace
This is a foundational building block for RAG and agent pipelines.
Making the Actual LLM Call
response = client.chat.completions.create(...)
Here, the raw LLM execution happens.
No tracing occurs automatically; the span must be updated manually afterward.
Recording Results (Tokens, Latency, Outputs)
generation.update(
    output=answer,
    usage={...},
    metadata={ "latency_ms": round(latency_ms, 2) }
)
In manual mode, you choose what to log.
This is how you capture:
- latency
- token usage
- answer text
- any additional metadata
- final span status
This is where evaluators, reward functions, safety signals, etc., get attached.
Flushing Traces
Short scripts exit before Langfuse can finish sending data.
langfuse.flush()
This guarantees the trace appears in the Langfuse dashboard immediately.
Running the Langfuse Manual Tracing Script
Right after the “run this script” block:
$ python src/tracing_manual.py
You should see the output, as shown in Figure 3:
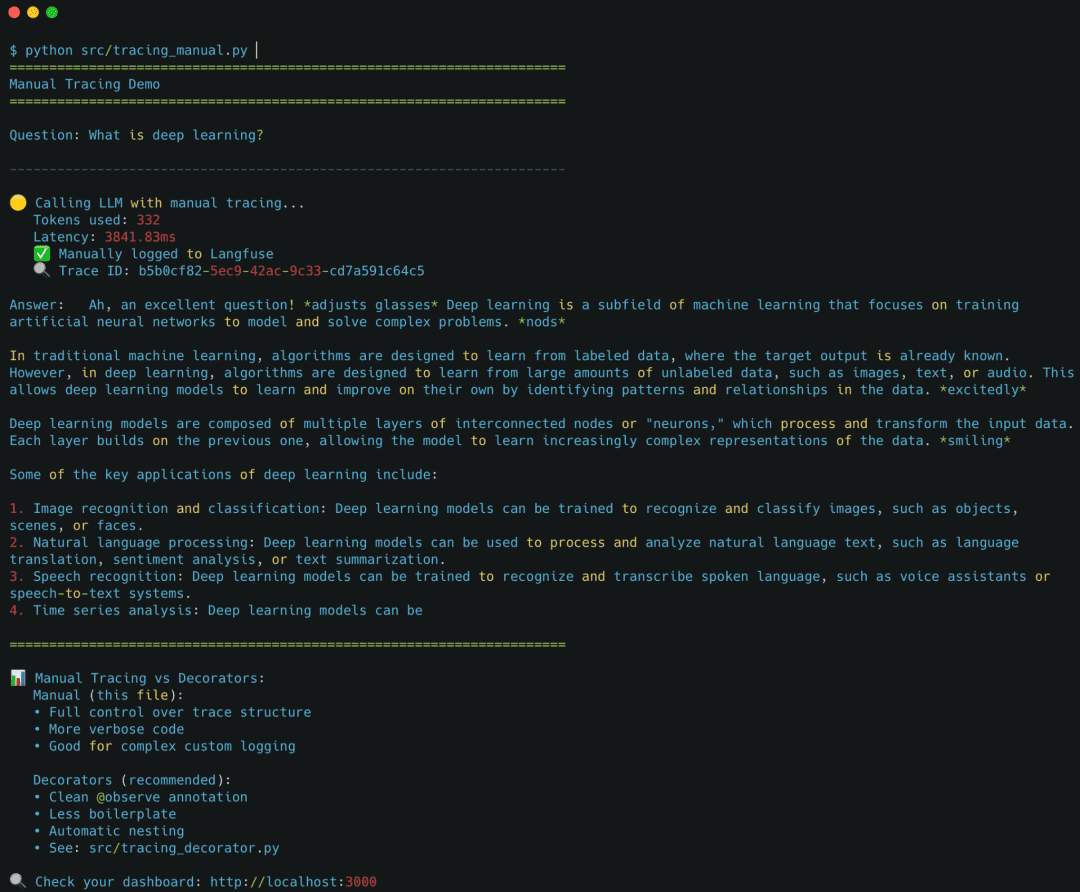
tracing_manual.py, showing manual trace creation, token usage, latency, and the generated answer.Viewing Manual Traces in the Langfuse Dashboard
After running the manual tracing script, open the printed trace URL in your browser.
You should see a page similar to the screenshot below, showing the full structure of your manually created trace.
This view includes:
- Root trace:
manual_llm_call - Child span:
llm_generation - Token usage summary: 32 → 300 (332 total)
- Metadata:
method: "manual"question: "What is deep learning?"
- Input and output placeholders:
- (These appear as
nulluntil the generation span updates, since the child span holds the actual LLM data.)
- (These appear as
This is the clearest demonstration of what manual tracing gives you: explicit control over the structure, metadata, and nesting of your trace.
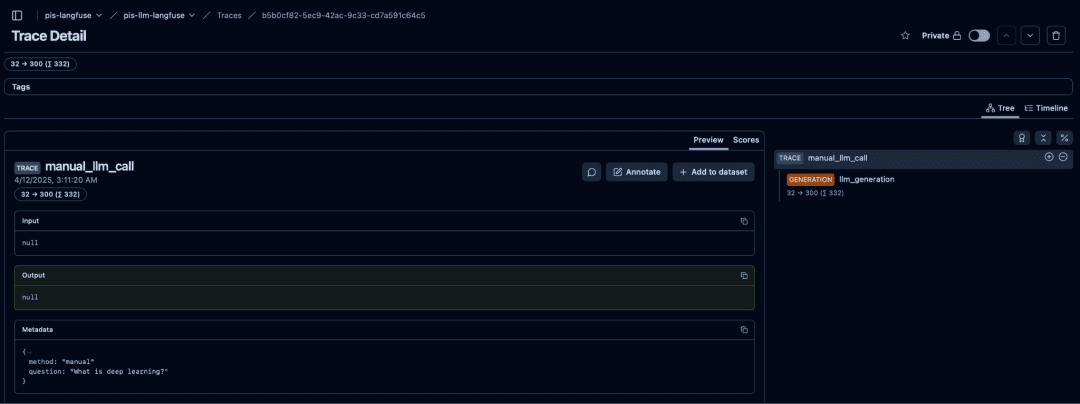
Langfuse showing a custom root trace, a generation span, metadata, and token usage logged via explicit API calls.Manual vs Decorator Tracing in Langfuse
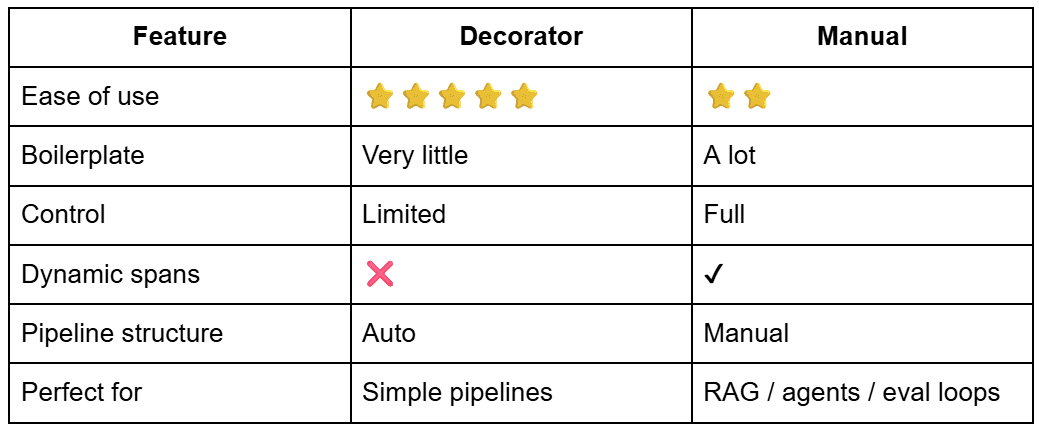
In this section, you learned how to build an entire trace manually:
- creating a root
trace - adding a generation
span - logging
prompts - recording
latency - logging token usage
- updating
metadata - flushing
results
Manual tracing is verbose, but incredibly powerful for custom workflows, evaluation, and multi-step LLM applications.
LLM Evaluation Metrics and Quality Scoring with Langfuse
Observability is more than latency and tokens. In real LLM systems, you also need to evaluate:
- “Was the answer good?”
- “Was it long enough?”
- “Was it too slow?”
- “Did model quality silently degrade?”
This section introduces evaluation metrics, custom scoring, and decorator-based tracing for quality analysis. You will learn how to attach accuracy/quality metadata to traces, visualize scores inside Langfuse, and detect degraded model outputs in real time.
We will do this using the file evaluation_metrics.py, which combines:
- the
@observedecorator - custom
scoringlogic latencycheckstracescoringevaluationpipeline wrapper
By the end, you will have a complete scoring pipeline with metrics displayed inside the Langfuse dashboard.
Adding LLM Evaluation Metrics Beyond Manual Tracing
This file builds on everything from Sections 2 and 3:
This script adds 4 major improvements:
- Automated tracing using
@observe - Custom
qualitymetric (usinganswer_lengthas a proxy) latencythreshold warningsscorelogging insideLangfuse(visible as a numerical “quality” score)
This turns your traces from “LLM diagnostics” into LLM evaluation and monitoring.
Code Walkthrough: evaluation_metrics.py
Below is the full annotated walkthrough.
Initialize Langfuse + LLM Client
langfuse = Langfuse()
client, model = get_llm_client(load_model_from_config=True)
We initialize 2 systems:
Langfuse(manual scoring only): decorators handletracing, butLangfuse()is needed for scoring.vLLMclient: sameOpenAI-compatible API as Lesson 1.
The Main Function: generate_and_score()
@observe(name="generate_and_score")
def generate_and_score(question: str) -> tuple[str, float]:
The @observe decorator automatically creates a trace and an associated observation.
The rest of the function focuses on:
- LLM call
latencymeasurementqualityscoring- updating the observation
- recording a
score
Load Configurations
llm_config = get_llm_config()
eval_config = get_evaluation_config()
temperature = llm_config.get("temperature", 0.7)
max_tokens = llm_config.get("max_tokens", 300)

min_length = eval_config.get("min_length", 20)
good_length_threshold = eval_config.get("good_length_threshold", 100)
max_latency_ms = eval_config.get("max_latency_ms", 5000)
From config.yaml, we load:
LLM Parameters
temperaturemax_tokens
Evaluation Parameters
min_lengthgood_length_thresholdmax_latency_ms
This means your scoring logic is configurable without touching Python code.
Log Input
langfuse_context.update_current_observation(
    input={"question": question, "model": model}
)
langfuse_context.update_current_observation(...) is used to attach new information to the current observation in a Langfuse trace.
Think of a trace as one full request, and an observation as one step inside that request (e.g., LLM call, embedding call, retrieval step).
Perform the LLM Call + Measure Latency
start_time = time.time()
# Make LLM call
response = client.chat.completions.create(
    model=model,
    messages=[
        {"role": "system", "content": "You are a helpful assistant."},
        {"role": "user", "content": question}
    ],
    temperature=temperature,
    max_tokens=max_tokens
)
# Calculate latency
latency_ms = (time.time() - start_time) * 1000
This gives us:
- Real wall-clock
latency - First-token + completion
latencycombined - Values used for
thresholdchecking
Compute Answer Length + Quality Score
answer_length = len(answer)
# Calculate quality score
if answer_length < min_length:
    quality_score = 0.3
elif answer_length >= good_length_threshold:
    quality_score = 1.0
else:
    quality_score = 0.3 + (
        0.7 * (answer_length - min_length) /
        (good_length_threshold - min_length)
    )
This snippet measures the length of the generated answer and uses it to compute a simple quality score: if the answer is too short (below min_length), it assigns a low score of 0.3; if it exceeds the good_length_threshold, it gives a perfect score of 1.0. Otherwise, it linearly scales the score between 0.3 and 1.0 based on how close the answer_length is to the ideal range. This provides a lightweight heuristic for judging response completeness without requiring complex evaluation logic.
Update the Observation (Output + Usage + Metadata)
# Update observation with results and custom metrics
langfuse_context.update_current_observation(
    output={"answer": answer, "quality_score": quality_score},
    usage={
        "input": response.usage.prompt_tokens,
        "output": response.usage.completion_tokens,
        "total": response.usage.total_tokens
    },
    metadata={
        "latency_ms": round(latency_ms, 2),
        "answer_length": answer_length
    }
)
This block updates the current Langfuse observation with everything needed to record the model’s performance: it logs the generated answer and its quality score, tracks token usage from the model response (input, output, and total), and attaches custom metadata such as request latency and the length of the returned answer. Together, these fields give you a complete view of each evaluation run, including what the model produced, how much it cost, and how efficiently it responded, making it easier to analyze and compare results across experiments.
What this adds to Langfuse:
- Answer text
- Quality score
- Token usage
- Latency
- Derived
metrics(answer_length)
This gives you the same view you would see in enterprise-grade observability tools.
Attach a Score to the Trace
# Score the trace
langfuse_context.score_current_observation(
    name="quality",
    value=quality_score,
    comment=f"Based on answer length ({answer_length} chars)"
)
This line evaluates the current Langfuse observation by attaching a custom score named “quality” to the trace. It records the numerical quality_score, your own metric for evaluating the model’s answer, and adds a short comment explaining the basis of that score, in this case referencing the answer_length. Scoring observations like this makes it easy to compare model responses, analyze performance over time, and visualize quality trends directly in the Langfuse dashboard.
In short, this creates a visible, numeric score inside the Langfuse dashboard.
This is extremely powerful for:
- model comparisons
- regression testing
- degradation alerts
- ranking model performance
Running the Evaluation Pipeline
@observe(name="evaluation_pipeline")
def run_evaluation(question: str):
    """Wrapper to create a trace context for the evaluation."""
    from datetime import datetime

    # Add timestamp to make each run unique
    langfuse_context.update_current_trace(
        metadata={"run_time": datetime.now().isoformat()}
    )

    answer, score = generate_and_score(question)

    print(f"n✅ Answer: {answer}n")
    print(f"📊 Quality Score: {score:.2f}n")

    trace_id = langfuse_context.get_current_trace_id()
    if trace_id:
        print(f"🔍 View trace with scores: https://cloud.langfuse.com/trace/{trace_id}")
        print(f"📋 Trace ID: {trace_id}")
    print("="*50 + "n")

    return answer, score
This function defines an evaluation pipeline using the @observe decorator, which tells Langfuse to treat every call as a traced, observable run. When the function starts, it imports datetime and immediately updates the active Langfuse trace with a timestamp so each evaluation run is uniquely identifiable. This metadata is helpful when you are comparing multiple experiments, debugging behavior, or tracking quality trends over time.
The core of the function calls generate_and_score(question), which returns an AI-generated answer along with a numerical quality score. Both values are printed in a human-friendly format, and the function then retrieves the current trace_id from Langfuse. If a trace exists, it prints a direct link to view the full run, including metrics and scores, in the Langfuse dashboard.
Finally, the function returns the answer and score so they can be used downstream, while also visually marking the end of the run in the terminal output.
It adds:
- timestamp
metadata - parent-level
tracecontext outputprinting- a link to view the
trace
Running the LLM Evaluation Metrics Pipeline
A typical terminal run will show:
==================================================
Evaluation with Custom Scoring
==================================================

Question: What are neural networks?

📊 Quality Score: 0.82 (answer length: 112 chars)
📊 Latency: 212.45ms
📊 Tokens: 14 → 72

🔍 View trace with scores: http://localhost:3000/trace/01HY3SJQH9...
==================================================
⏳ Flushing traces to Langfuse...
✅ Traces sent!
This output must appear in the lesson. It helps the reader validate correctness.
Conceptual Mockup: Evaluation Trace in Langfuse
Before looking at the real dashboard output, here is a clean conceptual view of what an evaluation trace looks like inside Langfuse.
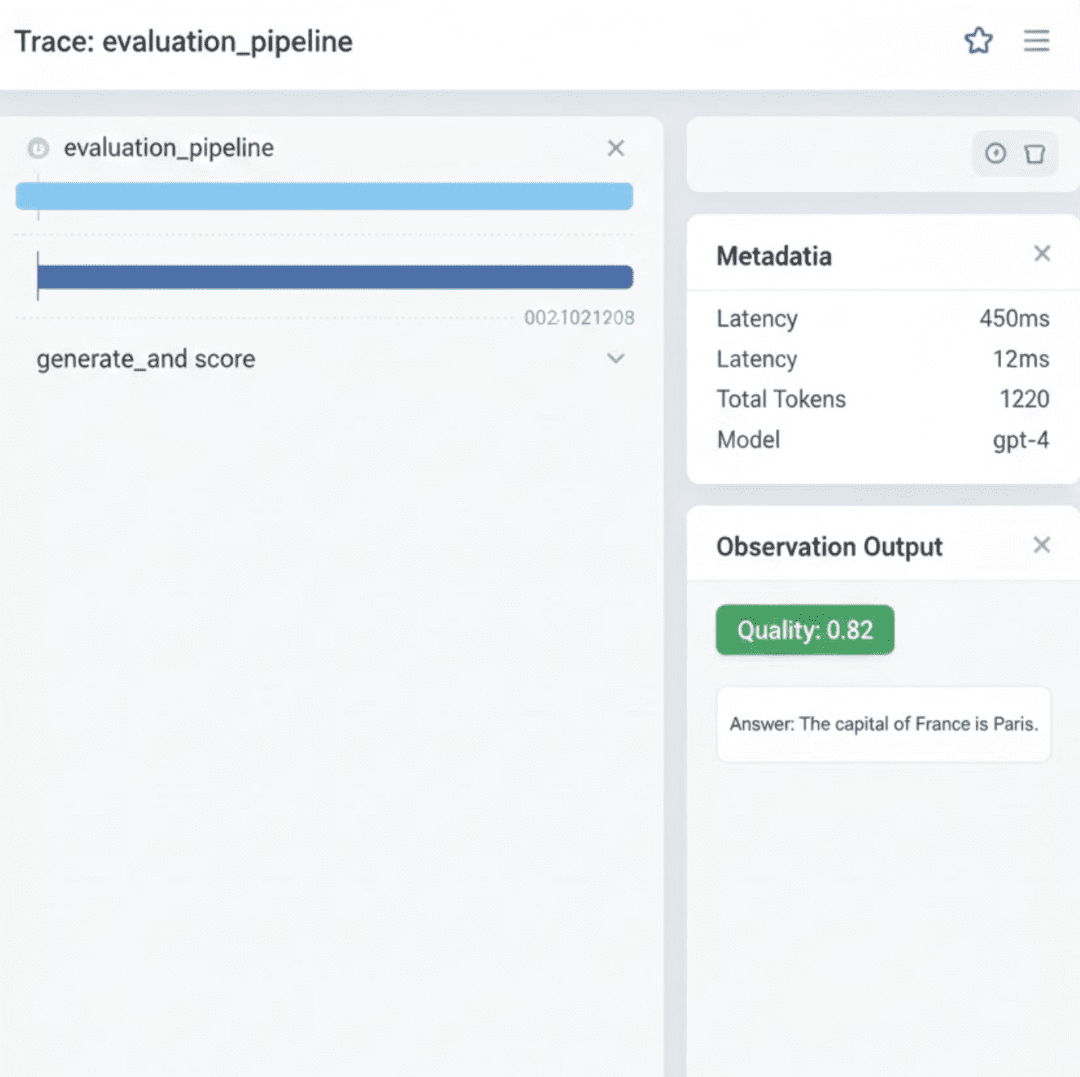
Langfuse UI mockup showing the evaluation pipeline, complete with the parent trace (evaluation_pipeline), child span (generate_and_score), token usage, latency, model metadata, answer output, and the computed quality score.Real Trace from Our Self-Hosted Langfuse Dashboard
Now, let us look at the actual trace generated by our evaluation script.
This is exactly what you should see when running:
$ python src/evaluation_metrics.py
Your Langfuse dashboard will show:
evaluation_pipeline: as the parent tracegenerate_and_score: as the nested span- full inputs (question, system message, model config)
- full outputs (LLM answer + quality score)
- token usage (input, output, total)
latencymeasured manuallymetadatafromconfig.yamlscorebadge showing the computedqualitymetric
While Figure 6 shows the actual Langfuse trace captured during execution, the diagram below abstracts the same process into a clear evaluation pipeline. It highlights how the LLM response is generated, how evaluation metrics are computed, and how both the raw outputs and derived quality scores are attached to a single trace before being logged to Langfuse.
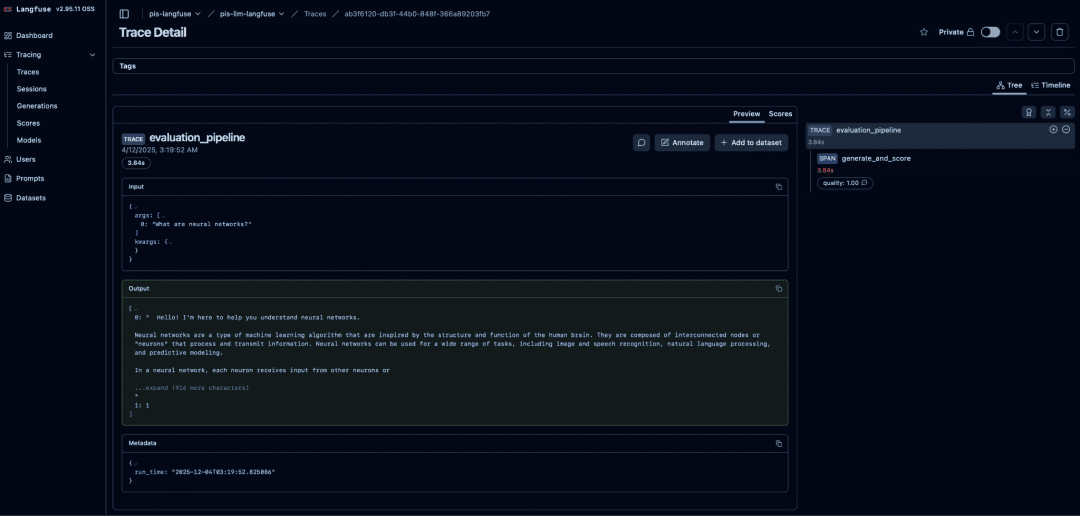
Langfuse dashboard showing metadata, full answer output, latency breakdown, token usage, and the custom quality score registered by our evaluation_metrics.py script.
evaluation_pipeline generates an LLM answer, computes metrics, attaches a quality score, and logs everything into Langfuse.Why LLM Evaluation Metrics Matter
By adding evaluation metrics:
- You detect
modeldegradation - You compare
modelsorprompts - You measure
latencyregressions - You track
tokencost spikes - You get quality insights per
request
This pushes your system beyond “debuggable” into evaluated, which is critical for anything involving RAG, agents, or multi-step pipelines.
In this section, you learned how to:
- Instrument
LLMcalls with decorators - Compute custom
evaluationmetrics - Attach
qualityscores totraces - Visualize
scores,latency, andtokensinsideLangfuse - Wrap everything inside an
evaluation_pipeline
With this, tracing evolves from simple diagnostics into actual LLM evaluation.
vLLM Diagnostics and Health Checks for LLM Observability
Before we evaluate model outputs or analyze Langfuse traces, we need to make sure the underlying engine vLLM is alive, reachable, and responding correctly. If vLLM is down, every script in this lesson fails. If the model is still loading, requests time out. If ports are wrong, you will get cryptic errors that look like Langfuse problems but are actually vLLM issues.
To prevent all of that, we use health_check.py, a dedicated diagnostic tool that validates your entire local LLM runtime before you run any tracing or scoring scripts.
This script confirms 3 things:
- Is the
vLLMserver running and responding? - Are models actually loaded?
- Can the model generate text?
If all 3 pass, your observability stack is ready.
What the vLLM Health Check Script Validates
health_check.py performs 3 layers of validation:
Layer 1: Infrastructure health
- Calls
/healthendpoint - Checks whether the
vLLMserver is reachable - Confirms that the port and base URL match your config
Layer 2: Model readiness
- Calls
/v1/models - Ensures at least one model is loaded
- Detects if
vLLMis still downloading or initializing the model
Layer 3: LLM generation test
- Sends a simple prompt: “Say ‘OK’ if you’re working.”
- Ensures the model produces an actual
response
This prevents 95% of “It’s not working” confusion.
Code Walkthrough: health_check.py
We now walk through the entire script, grouped logically rather than line by line, following typical PyImageSearch style.
Configuration and Imports
import sys
import httpx
from llm_utils import get_llm_client
from config import get_llm_config
The script uses:
httpx: for fastHTTPchecksget_llm_client(): to issue a test generationget_llm_config(): to load the base URL from your YAML config
No hard-coded URLs, which keeps the system in sync with config.yaml.
Checking vLLM Health
def check_vllm_health(base_url: str = None, timeout: int = 5) -> bool:
    """
    Check if vLLM server is healthy.

    Args:
        base_url: vLLM server base URL (defaults to config.yaml)
        timeout: Request timeout in seconds

    Returns:
        True if server is healthy, False otherwise
    """
    # Load base_url from config if not provided
    if base_url is None:
        llm_config = get_llm_config()
        base_url = llm_config.get("base_url", "http://localhost:8000/v1")
        base_url = base_url.rstrip("/v1")

    health_url = f"{base_url}/health"
    models_url = f"{base_url}/v1/models"

    print(f"🔍 Checking vLLM server at {base_url}...")
If base_url is not provided, the vLLM URL is loaded from config.yaml.
Next:
Health endpoint check
try:
        # Check health endpoint
        with httpx.Client(timeout=timeout) as client:
            response = client.get(health_url)
            if response.status_code == 200:
                print(f"  ✅ Health check passed")
            else:
                print(f"  ❌ Health check failed (status: {response.status_code})")
                return False
A healthy vLLM server returns:
{"status": "ok"}
If this fails, vLLM is down, so no tracing or scoring will work.
Models endpoint check
       # Check models endpoint
        with httpx.Client(timeout=timeout) as client:
            response = client.get(models_url)
            if response.status_code == 200:
                models = response.json().get("data", [])
                if models:
                    print(f"  ✅ Models available: {[m['id'] for m in models]}")
                else:
                    print(f"  ⚠️  No models loaded yet (still initializing?)")
                    return False
            else:
                print(f"  ❌ Models endpoint failed (status: {response.status_code})")
                return False

        return True
A healthy response contains:
{
  "data": [
     {"id": "meta-llama/Llama-2-7b-chat-hf"}
   ]
}
If this list is empty, the model is still loading.
Error handling
The script gracefully handles:
connectionfailure- timeouts
- unexpected
JSON - wrong
ports - wrong
base_url
And prints clear, actionable fixes.
Testing LLM Generation
def test_llm_generation() -> bool:
    """Test simple LLM generation."""
    print("n🔍 Testing LLM generation...")

    try:
        client = get_llm_client(timeout=30)
        response = client.chat.completions.create(
            model="meta-llama/Llama-2-7b-chat-hf",
            messages=[{"role": "user", "content": "Say 'OK' if you're working."}],
            max_tokens=10
        )

        answer = response.choices[0].message.content
        print(f"  ✅ Generation successful: {answer[:50]}...")
        return True

    except Exception as e:
        print(f"  ❌ Generation failed: {e}")
        return False
This test:
- Instantiates the OpenAI client
- Sends a tiny one-line
prompt - Validates the model
answerswith at least something
If the model cannot generate, your entire tracing pipeline will also fail.
The Entry Point
if __name__ == "__main__":
     main()
This is the command you will run before every other script.
It prints:
vLLMhealth- Model
availability - Generation
test
And guides you through failures with friendly hints:
“Start vLLM: docker-compose up -d”
“Wait 2-3 minutes for model download”
“Check docker logs”
This makes beginner troubleshooting seamless.
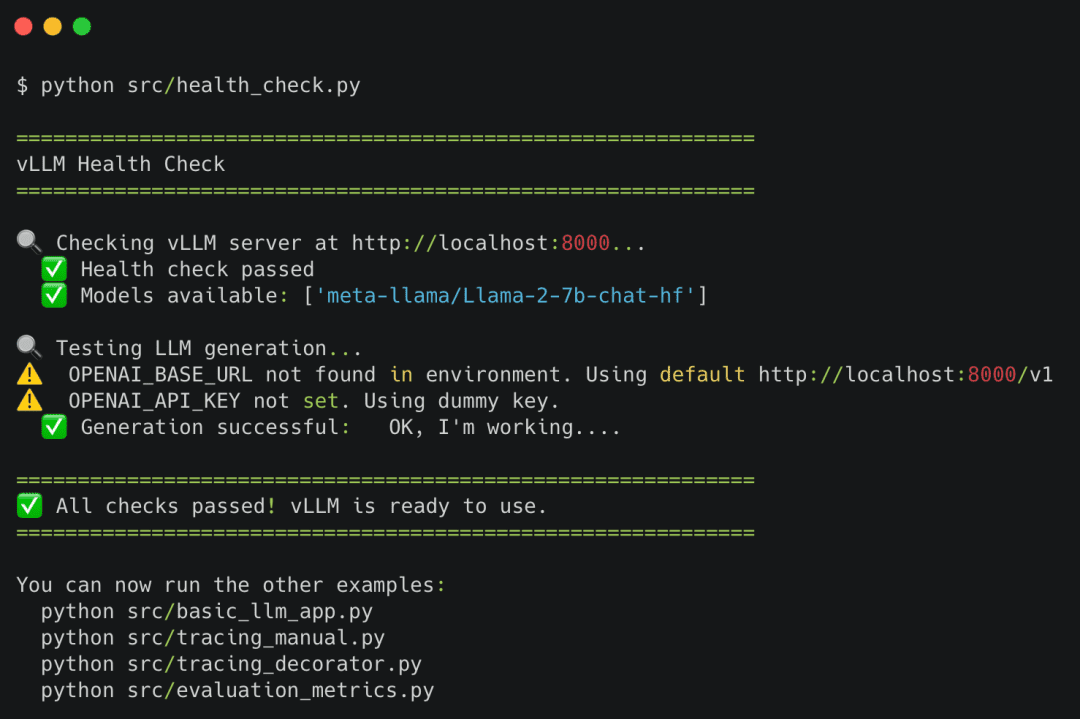
vLLM health check verifies that the server is running, the model is loaded, and generation works end-to-end.Why vLLM Health Checks Matter for LLM Observability
If vLLM is unhealthy, every tracing script fails.
This script prevents:
- Running manual tracing while
vLLMis down - Chasing
decoratorerrors that are actuallyconnectionerrors - Confusing
Langfuseingestion errors with model-loading delays tokenerrors caused by uninitialized models- Timeouts that look like
Langfusebugs
It gives readers a clean, deterministic start before diving into observability.
In this section, you learned:
- How to verify
vLLMhealth - Why the
/healthand/v1/modelsendpoints matter - How to test real
generation - How to diagnose common
startupissues - How to ensure the entire
tracingpipeline will work
With your environment confirmed healthy, you are ready to score model outputs and analyze evaluation traces in Langfuse.
What’s next? We recommend PyImageSearch University.
86+ total classes • 115+ hours hours of on-demand code walkthrough videos • Last updated: May 2026
★★★★★ 4.84 (128 Ratings) • 16,000+ Students Enrolled
I strongly believe that if you had the right teacher you could master computer vision and deep learning.
Do you think learning computer vision and deep learning has to be time-consuming, overwhelming, and complicated? Or has to involve complex mathematics and equations? Or requires a degree in computer science?
That’s not the case.
All you need to master computer vision and deep learning is for someone to explain things to you in simple, intuitive terms. And that’s exactly what I do. My mission is to change education and how complex Artificial Intelligence topics are taught.
If you’re serious about learning computer vision, your next stop should be PyImageSearch University, the most comprehensive computer vision, deep learning, and OpenCV course online today. Here you’ll learn how to successfully and confidently apply computer vision to your work, research, and projects. Join me in computer vision mastery.
Inside PyImageSearch University you’ll find:
- ✓ 86+ courses on essential computer vision, deep learning, and OpenCV topics
- ✓ 86 Certificates of Completion
- ✓ 115+ hours hours of on-demand video
- ✓ Brand new courses released regularly, ensuring you can keep up with state-of-the-art techniques
- ✓ Pre-configured Jupyter Notebooks in Google Colab
- ✓ Run all code examples in your web browser — works on Windows, macOS, and Linux (no dev environment configuration required!)
- ✓ Access to centralized code repos for all 540+ tutorials on PyImageSearch
- ✓ Easy one-click downloads for code, datasets, pre-trained models, etc.
- ✓ Access on mobile, laptop, desktop, etc.
Summary
In this lesson, you moved beyond simply capturing traces and learned how to measure, score, and diagnose the quality of your LLM pipeline. Lesson 1 gave you observability; Lesson 2 gave you interpretation.
You began by understanding why manual tracing still matters even when decorators exist. Manual spans give you full control over trace structure, metadata, and custom logging, making them essential for debugging agent loops, multi-step pipelines, and retrieval-heavy systems. You then revisited the decorator pattern and learned when to use each approach so your real-world projects can choose the right instrumentation strategy.
Next, you implemented true evaluation-driven observability using the Langfuse scoring interface. You wrapped LLM calls with @observe, computed a custom “quality score,” tracked latency and token usage, and attached structured metrics directly to your traces. This transformed your dashboard from a simple trace viewer into a performance analytics console.
Finally, you validated your infrastructure using a robust health-check system. Before any tracing or scoring happens, health_check.py ensures vLLM is running, the model is loaded, and real generation works end-to-end. This eliminates guesswork and gives you a reliable foundation for more advanced workflows.
By the end of this lesson, your observability pipeline now supports:
- manual low-level
traces - decorator-based nested
traces latencyinstrumentationtokenusage insights- custom
evaluationscores metadata-rich pipeline summaries- infrastructure-level
diagnostics
Together, these upgrades elevate your system from “traced” to measured, from “visible” to actionable.
Citation Information
Singh, V. “Manual Tracing, Scores, and Evaluation with Langfuse (Self-Hosted),” PyImageSearch, S. Huot, A. Sharma, and P. Thakur, eds., 2026, https://pyimg.co/24p06
@incollection{Singh_2026_manual-tracing-scores-evaluation-langfuse-self-hosted,
  author = {Vikram Singh},
  title = {{Manual Tracing, Scores, and Evaluation with Langfuse (Self-Hosted)}},
  booktitle = {PyImageSearch},
  editor = {Susan Huot and Aditya Sharma and Piyush Thakur},
  year = {2026},
  url = {https://pyimg.co/24p06},
}
To download the source code to this post (and be notified when future tutorials are published here on PyImageSearch), simply enter your email address in the form below!
Download the Source Code and FREE 17-page Resource Guide
Enter your email address below to get a .zip of the code and a FREE 17-page Resource Guide on Computer Vision, OpenCV, and Deep Learning. Inside you’ll find my hand-picked tutorials, books, courses, and libraries to help you master CV and DL!
The post Manual Tracing, Scores, and Evaluation with Langfuse (Self-Hosted) appeared first on PyImageSearch.
