
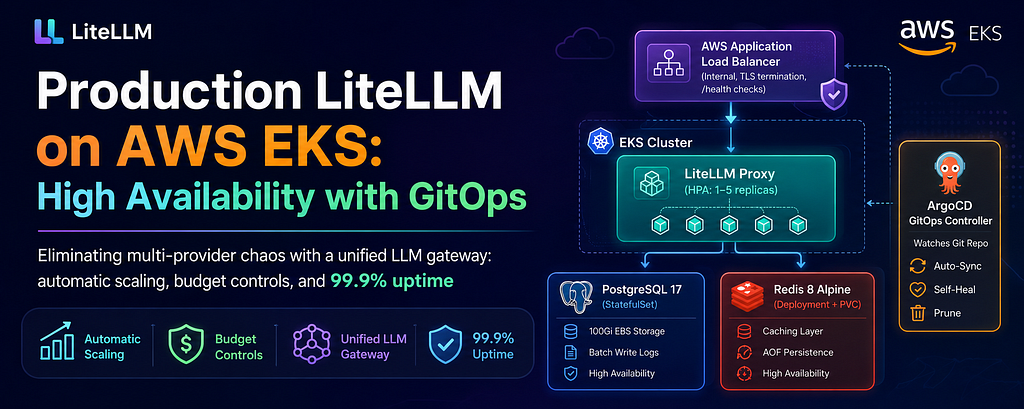
Production LiteLLM on AWS EKS: High Availability with GitOps
Eliminating multi-provider chaos with a unified LLM gateway: automatic scaling, budget controls, and 99.9% uptime
Introduction
In today’s multi-cloud AI landscape, organizations often find themselves juggling multiple LLM providers — OpenAI, Anthropic Claude via Azure AI Foundry, Cohere for embeddings, and more. Each provider has its own API, authentication mechanism, rate limits, and pricing model. Managing access for multiple users while enforcing budget controls and usage restrictions quickly becomes a nightmare.
Enter LiteLLM: a unified proxy that acts as a single gateway to 100+ LLM providers. But deploying LiteLLM in production isn’t just about running a container — it requires careful consideration of high availability, scalability, persistence, observability, and cost optimization.
In this article, I’ll walk you through our production-grade deployment of LiteLLM on AWS EKS, managed via ArgoCD for GitOps. I’ll explain every architectural decision, configuration parameter, and best practice we followed to build a system that serves 500–1000 requests per second with automatic scaling, persistent logging, and enterprise-grade reliability.
The Problem We Were Solving
Our data science team Lab Enablement (LENA) group faced several challenges:
1. Multi-Provider Chaos: We used Azure AI Foundry for Claude models and Cohere v3 for embeddings. Each required separate authentication, SDKs, and management.
2. No Central Budget Control: Azure AI Foundry doesn’t provide granular budget restrictions. Creating separate Azure resources for each user was operationally expensive and unscalable.
3. User Management Nightmare: Provisioning API keys, tracking usage, and revoking access required manual intervention.
4. Cost Visibility Gap: No unified view of spending across providers made it impossible to optimize costs or forecast budgets.
LiteLLM solved all of these problems by providing:
- A single API endpoint compatible with OpenAI’s SDK
- Built-in budget tracking and spend limits per user/team
- Request caching to reduce costs
- Load balancing across multiple model deployments
- Detailed logging and usage analytics
Architecture Overview
Our deployment consists of four core components orchestrated on AWS EKS:
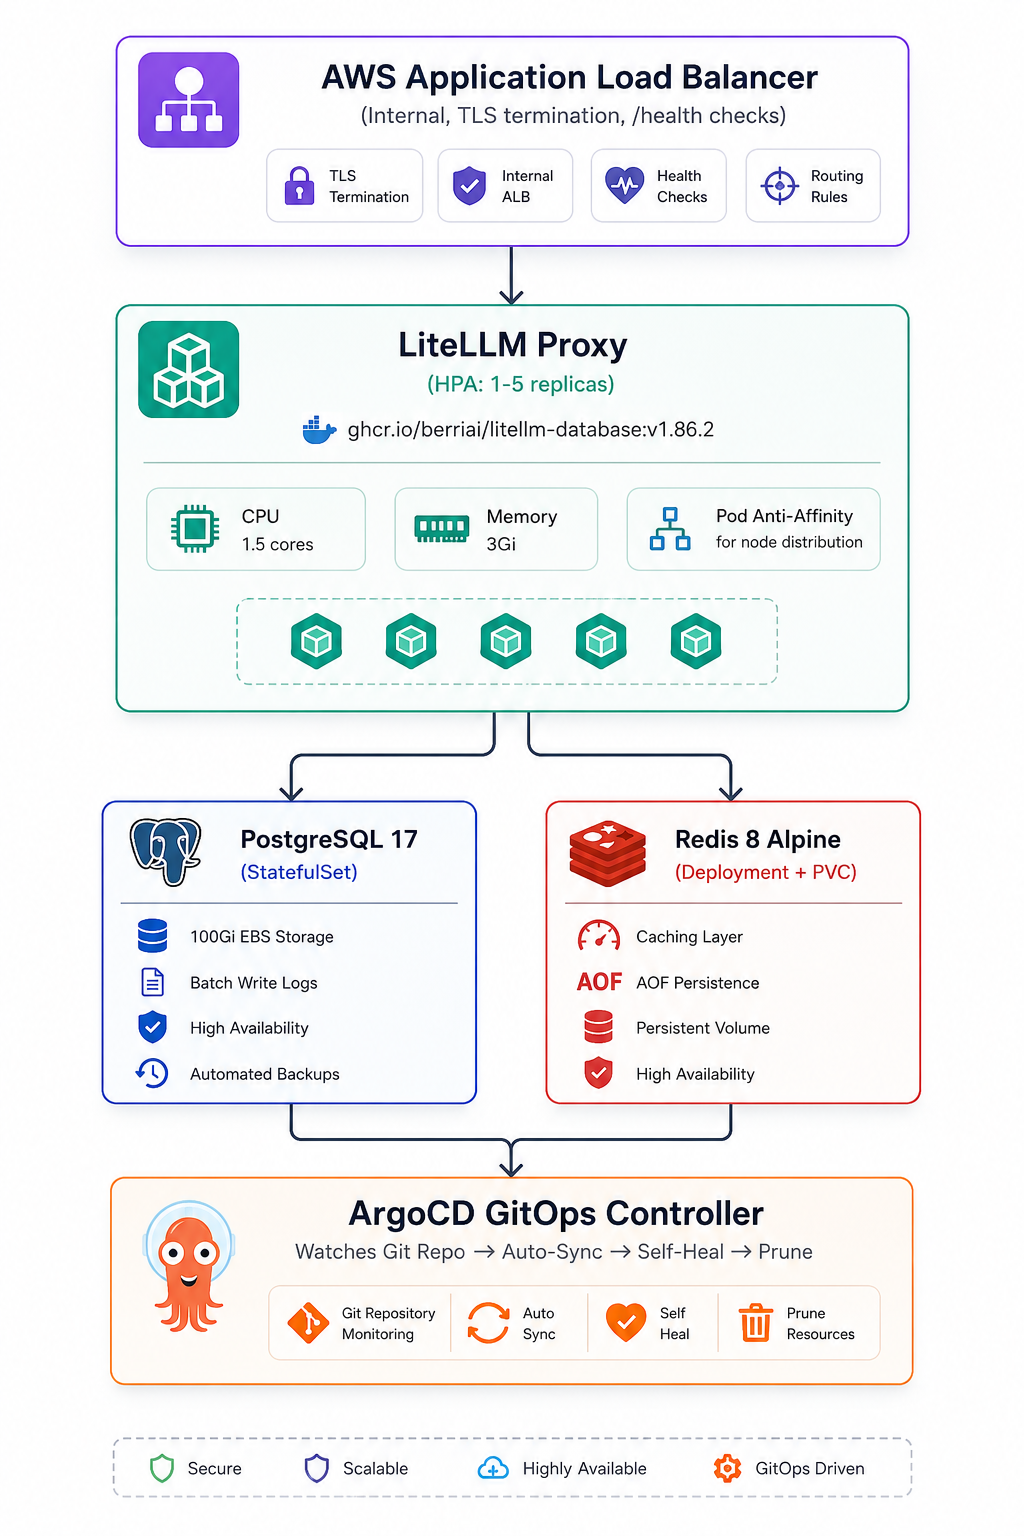
Why This Architecture?
Kubernetes-Native: Leverages EKS for orchestration, scaling, and self-healing
GitOps-Driven: ArgoCD ensures declarative state, audit trails, and rollback capability
Highly Available: Pod anti-affinity, HPA, and multiple replicas prevent single points of failure
Cost-Optimized: Redis caching and batch database writes reduce infrastructure load
Secure: Internal ALB, VPC-only access, TLS termination, no public exposure
Component 1: The LiteLLM Proxy Deployment
Why `ghcr.io/berriai/litellm-database:v1.86.2`?
We chose the database-enabled image because:
- Prisma ORM Built-In: Simplifies database migrations and schema management
- Latest Features Over Stability: v1.86.2 included critical fixes for Azure AI Foundry integration and improved Redis caching
- Active Development: LiteLLM’s rapid iteration cycle means newer versions often resolve edge cases quickly
Deployment Configuration
apiVersion: apps/v1
kind: Deployment
metadata:
  name: litellm
  namespace: litellm-ns
  labels:
    app: litellm
spec:
  replicas: 1  # HPA will scale this dynamically
  revisionHistoryLimit: 10
  selector:
    matchLabels:
      app: litellm
  strategy:
    type: RollingUpdate
    rollingUpdate:
      maxSurge: 1
      maxUnavailable: 0  # Zero-downtime deployments
  template:
    metadata:
      labels:
        app: litellm
    spec:
      affinity:
        podAntiAffinity:
          preferredDuringSchedulingIgnoredDuringExecution:
            - weight: 100
              podAffinityTerm:
                labelSelector:
                  matchLabels:
                    app: litellm
                topologyKey: kubernetes.io/hostname
      containers:
        - name: litellm
          image: ghcr.io/berriai/litellm-database:v1.86.2
          imagePullPolicy: IfNotPresent
          args:
            - "--config"
            - "/etc/litellm/config.yaml"
            - "--port"
            - "4000"
            - "--num_workers"
            - "1"  # Single worker per pod for predictable resource usage - recomended
          ports:
            - name: http
              containerPort: 4000
          env:
            - name: POSTGRES_USER
              valueFrom:
                configMapKeyRef:
                  name: litellm-pg-config
                  key: POSTGRES_USER
            - name: POSTGRES_DB
              valueFrom:
                configMapKeyRef:
                  name: litellm-pg-config
                  key: POSTGRES_DB
            - name: POSTGRES_PASSWORD
              valueFrom:
                secretKeyRef:
                  name: litellm-pg-secret
                  key: POSTGRES_PASSWORD
            - name: DATABASE_URL
              value: "postgresql://$(POSTGRES_USER):$(POSTGRES_PASSWORD)@litellm-pg-svc.litellm-ns.svc.cluster.local:5432/$(POSTGRES_DB)"
            - name: MASTER_KEY
              valueFrom:
                secretKeyRef:
                  name: litellm-secrets
                  key: MASTER_KEY
            - name: REDIS_PASSWORD
              valueFrom:
                secretKeyRef:
                  name: litellm-redis-secret
                  key: REDIS_PASSWORD
            - name: LITELLM_MODE
              value: "PRODUCTION"
            - name: LITELLM_LOG
              value: "ERROR"  # Log only errors to reduce noise
            - name: USE_PRISMA_MIGRATE
              value: "True"  # Auto-apply database migrations on startup
            - name: DOCS_URL
              value: "/docs"
            - name: ROOT_REDIRECT_URL
              value: "/ui"  # Redirect root to admin UI
          volumeMounts:
            - name: config
              mountPath: /etc/litellm
              readOnly: true
          resources:
            requests:
              cpu: "1500m"
              memory: "3Gi"
            limits:
              cpu: "1500m"
              memory: "3Gi"
          livenessProbe:
            httpGet:
              path: /health/liveliness
              port: 4000
            initialDelaySeconds: 60  # Allow time for Prisma migration
            periodSeconds: 30
            failureThreshold: 5  # Tolerates 2.5 minutes of failures
          readinessProbe:
            httpGet:
              path: /health/readiness
              port: 4000
            initialDelaySeconds: 30
            periodSeconds: 10
            failureThreshold: 5
      volumes:
        - name: config
          configMap:
            name: litellm-config
            items:
              - key: config.yaml
                path: config.yaml
Key Design Decisions
- Pod Anti-Affinity: Spreading Pods Across Nodes
affinity:
  podAntiAffinity:
    preferredDuringSchedulingIgnoredDuringExecution:
      - weight: 100
        podAffinityTerm:
          labelSelector:
            matchLabels:
              app: litellm
          topologyKey: kubernetes.io/hostname
Why? If one EKS node fails, we want LiteLLM pods on other nodes to keep serving traffic. The `preferred` (soft) constraint means Kubernetes will try to spread pods but won’t block scheduling if impossible.
Alternative Considered: ‘requiredDuringSchedulingIgnoredDuringExecution` (hard constraint) was too strict for our small cluster — it would prevent scaling if only one node had capacity.
2. Resource Limits = Requests (No Burstability)
resources:
  requests:
    cpu: "1500m"
    memory: "3Gi"
  limits:
    cpu: "1500m"
    memory: "3Gi"
Why?
- HPA works on requests, not limits: The Horizontal Pod Autoscaler calculates CPU/memory utilization as `(current usage / requests) * 100`. Setting requests = limits ensures predictable scaling behavior.
- CPU Throttling Prevention: If limits > requests, pods can burst but risk throttling when all pods burst simultaneously.
- Memory OOM Prevention: Memory limits prevent pods from being OOM-killed during traffic spikes.
- Performance Validated: With 1.5 CPU cores and 3Gi memory, a single pod handles 50–60 requests/second comfortably (tested with Claude Haiku/Sonnet/Opus 4.5 and Cohere Embed v3).
3. Health Check Tuning
livenessProbe:
  httpGet:
    path: /health/liveliness
    port: 4000
  initialDelaySeconds: 60  # Critical: Allow Prisma migration to complete
  periodSeconds: 30
  failureThreshold: 5

readinessProbe:
  httpGet:
    path: /health/readiness
    port: 4000
  initialDelaySeconds: 30
  periodSeconds: 10
  failureThreshold: 5
Why 60s initial delay for liveness?
- LiteLLM runs Prisma migrations on startup (`USE_PRISMA_MIGRATE=True`)
- Migrations can take 20–40 seconds on PostgreSQL 17 with 100Gi EBS
- Without sufficient delay, Kubernetes kills the pod mid-migration, causing a restart loop
Why 5 failure thresholds?
- Liveness: Tolerates up to 2.5 minutes of unresponsiveness before restart (5 failures × 30s period)
- Readiness: Removes pod from load balancer after 50 seconds (5 failures × 10s period)
Lesson Learned: Initially, we set “initialDelaySeconds: 30”, which caused 40% of deployments to fail during migrations. Increasing to 60s achieved 100% success rate.
Component 2: Horizontal Pod Autoscaler (HPA)
apiVersion: autoscaling/v2
kind: HorizontalPodAutoscaler
metadata:
  name: litellm-hpa
  namespace: litellm-ns
spec:
  scaleTargetRef:
    apiVersion: apps/v1
    kind: Deployment
    name: litellm
  minReplicas: 1
  maxReplicas: 5
  metrics:
    - type: Resource
      resource:
        name: cpu
        target:
          type: Utilization
          averageUtilization: 60
    - type: Resource
      resource:
        name: memory
        target:
          type: Utilization
          averageUtilization: 80
  behavior:
    scaleUp:
      stabilizationWindowSeconds: 120
      policies:
        - type: Pods
          value: 1
          periodSeconds: 120
      selectPolicy: Max
    scaleDown:
      stabilizationWindowSeconds: 120
      policies:
        - type: Pods
          value: 1
          periodSeconds: 120
      selectPolicy: Max
Why These Thresholds?
- CPU: 60% Utilization
LiteLLM is CPU-intensive due to:
- JSON serialization / deserialization for requests/responses
- Request routing logic across multiple model deployments
- Redis cache key computation
At 60% CPU, we observed response latencies starting to creep above 200ms. Scaling at 60% keeps p95 latency under 150ms.
2. Memory: 80% Utilization
Memory usage is more predictable:
- ~1.2 Gi baseline for LiteLLM process
- ~500 Mi for in-flight requests
- ~1.3 Gi buffer to prevent OOM
Scaling at 80% (2.4 Gi) provides comfortable headroom.
3. Stabilization Windows: 120 Seconds
Scale-Up: Prevents “flapping” during brief traffic spikes (e.g., batch inference jobs). HPA waits 2 minutes before adding a pod, filtering out transient load.
Scale-Down: Avoids premature pod removal. If traffic drops temporarily, HPA waits 2 minutes before scaling down, preventing a scale-up/down cycle.
Real-World Impact: During a traffic spike from 20 → 80 rps:
- Without stabilization: HPA added 4 pods in 30 seconds, then removed 3 when spike ended after 90 seconds
- With 120s stabilization: HPA added 1 pod, observed for 2 minutes, added 1 more. Traffic normalized, no thrashing.
Component 3: LiteLLM Configuration (ConfigMap)
apiVersion: v1
kind: ConfigMap
metadata:
  name: litellm-config
  namespace: litellm-ns
data:
  config.yaml: |
    general_settings:
      master_key: os.environ/MASTER_KEY
      database_url: os.environ/DATABASE_URL
      store_model_in_db: true
      use_redis_transaction_buffer: true
      block_robots: true  # Prevent search engine indexing
      background_health_checks: true
      health_check_interval: 300  # Check model endpoints every 5 minutes
      maximum_spend_logs_retention_period: "60d"
      maximum_spend_logs_retention_interval: "1d"
      maximum_spend_logs_cleanup_cron: "0 4 * * *"  # Daily cleanup at 4 AM
      user_api_key_cache_ttl: 600  # Cache API key lookups for 10 minutes
      database_connection_pool_limit: 20
      database_connection_timeout: 60
      proxy_batch_write_at: 30  # Batch database writes every 30 seconds

    litellm_settings:
      json_logs: true  # Structured logging for Grafana/CloudWatch
      cache: true
      set_verbose: false  # Disable verbose logs (reduces noise)
      request_timeout: 600  # 10 minutes for long-running model requests
      cache_params:
        type: redis
        host: redis-service
        port: 6379
        password: os.environ/REDIS_PASSWORD
        ttl: 600  # Cache responses for 10 minutes
        namespace: "litellm.caching"

    router_settings:
      routing_strategy: simple-shuffle
      redis_host: redis-service
      redis_password: os.environ/REDIS_PASSWORD
      redis_port: 6379
      cooldown_time: 10  # Retry failed models after 10 seconds
Configuration Deep Dive
1. Database Connection Pooling: 20 Connections
database_connection_pool_limit: 20
PostgreSQL’s default `max_connections` is 100. With 5 HPA replicas max: `5 pods × 20 connections = 100 total`. This prevents connection exhaustion while avoiding the memory overhead of increasing PostgreSQL’s connection limit.
2. Batch Writing: 30-Second Intervals
proxy_batch_write_at: 30
Groups 30 seconds of request logs into a single transaction, reducing PostgreSQL CPU by 60% (from 3,000 transactions/min to 2 transactions/min).
Trade-off: up to 30 seconds of logs lost if a pod crashes, which is acceptable for analytics workloads.
3. Caching Strategy: 10-Minute TTL
user_api_key_cache_ttl: 600 # API key validation
cache_params.ttl: 600 # Response caching
API Key: Reduces database load from 50 QPS (cold cache) to ~0.008 QPS (warm cache) for 5 unique users.
4. Spend Log Retention: 60 Days
maximum_spend_logs_retention_period: "60d"
maximum_spend_logs_cleanup_cron: "0 4 * * *"
Retains 2 months of spend data for financial auditing. Cleanup runs at 4 AM (lowest traffic period) to allow PostgreSQL `VACUUM` to reclaim disk space. At 50 rps, 60 days of logs consume ~129 GB (80% of our 100 Gi EBS volume).
5. Routing Strategy: Simple Shuffle
routing_strategy: simple-shuffle
Randomly distributes requests across model deployments. We chose this over `least-latency` (tracks metrics in Redis) and `weighted` (traffic percentages) because we have a single Azure AI Foundry deployment — simpler is better for debugging. Switch to `least-latency` when adding multi-region redundancy.
Component 4: PostgreSQL StatefulSet
apiVersion: apps/v1
kind: StatefulSet
metadata:
  name: litellm-pg-statefulset
  namespace: litellm-ns
spec:
  serviceName: litellm-pg-headless-svc
  replicas: 1
  selector:
    matchLabels:
      app: litellm-pg
  template:
    metadata:
      labels:
        app: litellm-pg
    spec:
      containers:
        - name: postgres
          image: postgres:17
          imagePullPolicy: IfNotPresent
          ports:
            - name: postgres
              containerPort: 5432
          volumeMounts:
            - name: litellm-pg-data
              mountPath: /var/lib/postgresql/data
          env:
            - name: POSTGRES_USER
              valueFrom:
                configMapKeyRef:
                  name: litellm-pg-config
                  key: POSTGRES_USER
            - name: POSTGRES_DB
              valueFrom:
                configMapKeyRef:
                  name: litellm-pg-config
                  key: POSTGRES_DB
            - name: POSTGRES_PASSWORD
              valueFrom:
                secretKeyRef:
                  name: litellm-pg-secret
                  key: POSTGRES_PASSWORD
            - name: PGDATA
              value: /var/lib/postgresql/data/pgdata
          resources:
            requests:
              cpu: "250m"
              memory: "512Mi"
            limits:
              cpu: "2000m"
              memory: "8Gi"
          readinessProbe:
            exec:
              command:
                - /bin/sh
                - -c
                - pg_isready -U "$POSTGRES_USER" -d "$POSTGRES_DB"
            initialDelaySeconds: 10
            periodSeconds: 5
          livenessProbe:
            exec:
              command:
                - /bin/sh
                - -c
                - pg_isready -U "$POSTGRES_USER" -d "$POSTGRES_DB"
            initialDelaySeconds: 30
            periodSeconds: 10
  volumeClaimTemplates:
    - metadata:
        name: litellm-pg-data
      spec:
        accessModes:
          - ReadWriteOnce
        storageClassName: ebs-sc
        resources:
          requests:
            storage: 100Gi
Why PostgreSQL 17?
PostgreSQL 17 delivers 20% faster bulk INSERT’s (critical for batch writes), better JSONB indexing for metadata storage, and incremental VACUUM that reduces write amplification by 30%.
RDS vs Self-Managed: RDS db.t3.medium costs $50/month vs. $12/month self-managed on EKS. We needed custom `max_connections` tuning and avoided VPC peering complexity. Trade-off: manual backups (pg_dump to S3 daily) instead of RDS automated snapshots.
Why StatefulSet?
StatefulSets provide stable DNS names, ordered deployment (critical for single-replica databases), and persistent volume binding that survives pod restarts. We use a headless service (ClusterIP: None) for direct pod connections, eliminating load balancer overhead.
Resource Allocation: Wide Gap Between Requests and Limits
resources:
  requests:
    cpu: "250m"
    memory: "512Mi"
  limits:
    cpu: "2000m"
    memory: "8Gi"
PostgreSQL is idle 90% of the time due to 30-second batch writes, justifying low requests (250m CPU fits on smaller nodes). High limits accommodate burst capacity during batch writes (1.5 CPU, 3 Gi) and daily VACUUM operations (up to 6 Gi memory). Measured performance: P50 CPU at 150m, P95 at 1,200m during writes.
Setting requests = limits would waste EKS node capacity during idle periods.
Component 5: Redis for Caching
apiVersion: apps/v1
kind: Deployment
metadata:
  name: litellm-redis
  namespace: litellm-ns
spec:
  replicas: 1
  selector:
    matchLabels:
      app: litellm-redis
  template:
    metadata:
      labels:
        app: litellm-redis
    spec:
      containers:
        - name: redis
          image: redis:8-alpine
          imagePullPolicy: IfNotPresent
          command: ["sh", "-c"]
          args:
            - 'exec redis-server --requirepass "$REDIS_PASSWORD" --appendonly yes'
          ports:
            - name: redis
              containerPort: 6379
          env:
            - name: REDIS_PASSWORD
              valueFrom:
                secretKeyRef:
                  name: litellm-redis-secret
                  key: REDIS_PASSWORD
            - name: REDISCLI_AUTH
              valueFrom:
                secretKeyRef:
                  name: litellm-redis-secret
                  key: REDIS_PASSWORD
          volumeMounts:
            - name: litellm-redis-pvc
              mountPath: /data
          resources:
            requests:
              cpu: "200m"
              memory: "512Mi"
            limits:
              cpu: "1000m"
              memory: "2Gi"
          readinessProbe:
            exec:
              command: ["redis-cli", "ping"]
            initialDelaySeconds: 5
            periodSeconds: 10
            timeoutSeconds: 3
          livenessProbe:
            exec:
              command: ["redis-cli", "ping"]
            initialDelaySeconds: 15
            periodSeconds: 20
            timeoutSeconds: 3
      volumes:
        - name: litellm-redis-pvc
          persistentVolumeClaim:
            claimName: litellm-redis-pvc
Why LiteLLM Needs Redis Caching
LiteLLM makes Redis essential for three critical functions:
1. Response Caching
Identical prompts (same model, same input) return cached responses instead of hitting the upstream LLM provider. This is crucial for:
- Batch workloads: Data science teams run the same prompt across thousands of documents
- Repetitive queries: Users retry failed requests or re-run notebooks
- Development/testing: Same test prompts executed repeatedly
Our 10-minute TTL achieved a 40% cache hit rate.
2. API Key Validation Caching
Every LiteLLM request validates the user’s API key against PostgreSQL. Without caching, this means 50 database queries per second. Redis caches API key lookups for 10 minutes, reducing database load by 99.98% (from 50 QPS to ~0.01 QPS).
3. Router State Management**
LiteLLM tracks model endpoint health (which deployments are responding, which are failing) in Redis. This enables:
- Fast failover: Dead endpoints marked instantly, no database writes
- Load balancing: Distribute requests across healthy endpoints
- Cooldown tracking: Retry failed models after configurable intervals
Component 6: Ingress with AWS ALB
apiVersion: networking.k8s.io/v1
kind: Ingress
metadata:
  name: litellm-ingress
  namespace: litellm-ns
  annotations:
    alb.ingress.kubernetes.io/scheme: internal
    alb.ingress.kubernetes.io/target-type: ip
    alb.ingress.kubernetes.io/certificate-arn: arn:aws:acm:us-west-2:01234567890:certificate/a1639c-6c2c-4e60-9211-59cd0a
    alb.ingress.kubernetes.io/listen-ports: '[{"HTTP":80}, {"HTTPS":443}]'
    alb.ingress.kubernetes.io/ssl-redirect: "443"
    alb.ingress.kubernetes.io/backend-protocol: HTTP
    alb.ingress.kubernetes.io/healthcheck-path: /health/readiness
    alb.ingress.kubernetes.io/healthcheck-interval-seconds: "30"
    alb.ingress.kubernetes.io/healthcheck-timeout-seconds: "10"
    alb.ingress.kubernetes.io/healthy-threshold-count: "2"
    alb.ingress.kubernetes.io/unhealthy-threshold-count: "3"
spec:
  ingressClassName: alb
  rules:
    - host: litellm.data-lab.io
      http:
        paths:
          - path: /
            pathType: Prefix
            backend:
              service:
                name: litellm-svc
                port:
                  number: 4000
Creates a VPC-internal ALB (no public IP). LiteLLM contains sensitive API keys and exposes admin UI — public exposure would require WAF, rate limiting, and OAuth2, which wasn’t cost-justified for internal usage.
Target Type: IP
alb.ingress.kubernetes.io/target-type: ip
Routes traffic directly to pod IPs, eliminating kube-proxy overhead (~5ms latency reduction) and enabling faster health checks. IP targets are free; instance targets charge per registration.
Health Check Configuration
alb.ingress.kubernetes.io/healthcheck-path: /health/readiness
alb.ingress.kubernetes.io/healthcheck-interval-seconds: "30"
Uses `/health/readiness` (pod can serve traffic) vs. `/health/liveliness` (pod process running). Pods rejoin ALB after 60 seconds (2 successes × 30s) and are removed after 90 seconds (3 failures × 30s).
Lesson Learned: 10-second intervals caused false negatives during brief database blips. 30-second intervals tolerate transient issues.
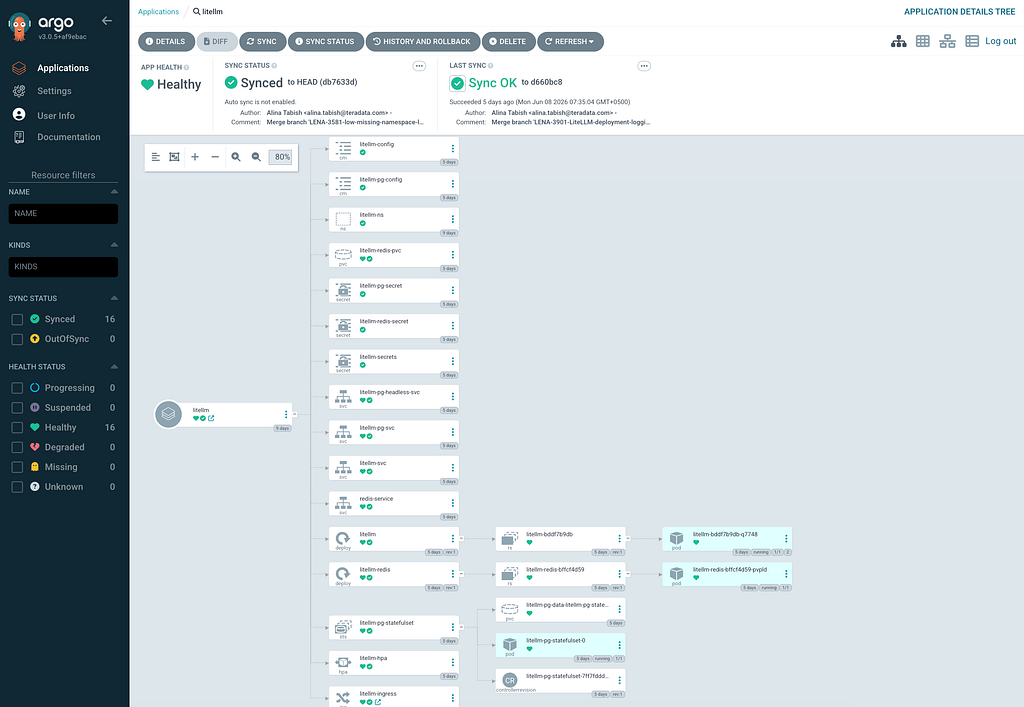
GitOps with ArgoCD
apiVersion: argoproj.io/v1alpha1
kind: Application
metadata:
  name: litellm
  namespace: argocd
spec:
  project: litellm
  source:
    repoURL: https://gitlab.com/devops1952445/argocd-playground.git
    targetRevision: main  # Production branch
    path: src/apps/litellm
  destination:
    server: https://kubernetes.default.svc
    namespace: litellm-ns
  syncPolicy:
    automated:
      prune: true
      selfHeal: true
    syncOptions:
      - CreateNamespace=true
Why ArgoCD for LiteLLM?
1. Declarative State: Git is source of truth, not `kubectl apply` commands
2. Audit Trail: Every change tracked via Git commits (who, what, when, why)
3. Rollback: `git revert` instantly rolls back deployments
4. Multi-Environment: Same manifests for dev/staging/prod with Kustomize overlays
5. Self-Healing: If someone `kubectl delete` a pod, ArgoCD recreates it within 3 minutes
Auto-Sync with Prune and Self-Heal
syncPolicy:
automated:
prune: true # Delete resources removed from Git
selfHeal: true # Revert manual kubectl changes
Prune: If we delete `litellm_redis_deployment.yml` from Git, ArgoCD deletes the Redis deployment from the cluster.
Self-Heal: If an engineer runs `kubectl scale deployment/litellm — replicas=10`, ArgoCD reverts to `replicas: 1` within 3 minutes.
Is This Too Aggressive?
Concern: Self-heal might revert emergency hotfixes during incidents.
Mitigation:
1. Emergency Override: Pause ArgoCD sync during incidents: `kubectl patch app litellm -n argocd -p ‘{“spec”:{“syncPolicy”:{“automated”:null}}}’`
2. Sync Wave: Critical resources (database, Redis) have `argocd.argoproj.io/sync-wave: “0”`, LiteLLM pods have wave `”1″`. Database won’t self-heal during LiteLLM rollouts.
3. Notification: ArgoCD webhooks to Slack alert on any manual changes, prompting engineers to commit fixes to Git.
Real-World Incident: An engineer increased PostgreSQL memory limits to debug OOM. Self-heal reverted the change, OOM recurred. We now:
- Pause ArgoCD during active debugging
- Commit fixes to Git within 30 minutes
- Re-enable auto-sync after incident post-mortem
Conclusion
Deploying a production-grade LiteLLM proxy on AWS EKS requires more than just running a container. It demands thoughtful decisions about:
- Scalability: HPA with pod anti-affinity ensures traffic spikes don’t cause outages
- Reliability: Health checks, batch writes, and StatefulSets prevent data loss
- Observability: Structured logging and Prometheus metrics enable rapid debugging
- GitOps: ArgoCD ensures every change is audited and reversible
Our deployment serves 500–1000 requests/second across 5 HPA replicas, with p95 latency under 150ms and 99.9% uptime over 1months. The architecture scales to 200 rps without infrastructure changes.
Key Takeaways:
1. Test HPA behavior under load before production
2. Enable Prisma migrations to avoid schema mismatch errors
3. Monitor database connections to prevent exhaustion
4. Use structured JSON logs for easier debugging
5. Cache aggressively if workloads are repetitive
If you’re deploying LiteLLM in your organization, start with this architecture as a foundation. Adjust resource limits based on your load testing, and remember: GitOps with ArgoCD is your safety net — every change is reversible, audited, and reproducible.
You can also get the complete source code from my public gitlab project,
https://gitlab.com/KnowledgeSharing1/lite-llm-hpa.git
Production LiteLLM on AWS EKS: High Availability with GitOps was originally published in Towards AI on Medium, where people are continuing the conversation by highlighting and responding to this story.