Three Ways an LLM on Your Warehouse Gets ‘Why Did Revenue Drop?’ Wrong-and How to Fix Each

Connecting a language model to your warehouse is a great demo and a bad diagnostic engine. Here are the three failures you’ll actually hit, each with a fix, in plain SQL.
Plug an LLM into your warehouse, type “why did revenue drop 8% last week?”, and you get a confident paragraph in forty seconds. It feels like the analyst bottleneck just disappeared.
Then you start checking the answers, and three problems show up-in order, each quieter than the last. None of them throws an error. Here’s each one on a real Postgres example, and what fixes it.
Error 1 — The SQL runs, but it’s not the number you mean
The question: “What was our revenue last month?”
What the model writes:
SELECT SUM(amount) AS revenue
FROM orders
WHERE created_at >= date_trunc('month', now()) - interval '1 month'
  AND created_at <  date_trunc('month', now());
Valid SQL. Runs clean. Returns a number. And it’s wrong, because orders contains things “revenue” doesn’t:
- cancelled and refunded orders are still in there
- test orders (is_test = true) are still in there
- amount mixes currencies — AED and EGP summed into one meaningless total
- created_at counts orders that were placed last month, not delivered — revenue you may never collect
The model didn’t know any of this, because the definition of “revenue” for your business doesn’t live in the schema. It lives in a dbt model nobody documented, or in the head of the analyst who left. So the model guessed, and the guess executed cleanly.
That’s the dangerous part. A wrong number that errors out, you catch. A wrong number that returns, you ship to your CEO.
The fix — pin the definition once, never let the model touch raw tables.
Define the metric the business actually means, as a view (or a dbt model), and point the model at that:
CREATE VIEW finance.net_revenue_orders AS   -- one row per delivered order
SELECT
  o.order_id,
  date_trunc('day', o.delivered_at)  AS day,            -- delivered, not placed
  o.city,
  o.gmv_usd                          AS net_revenue_usd -- currency-normalized upstream
FROM orders o
WHERE o.status = 'delivered'      -- not placed, not cancelled
  AND o.is_test = false;          -- no test traffic
One row per delivered order — this single view is the only source for every query below. Now “what was revenue last month” becomes SELECT SUM(net_revenue_usd) FROM finance.net_revenue_orders WHERE day >= … — exactly one definition of revenue, the one finance agreed on. This is what a semantic layer is for: the model translates the question, but the math runs on definitions you control. Failure stops looking like a plausible wrong number and starts looking like an error if a column doesn’t exist — which is the kind of failure you want.
The same trap, one level deeper: the fan-out join. Join orders to order_items (one order, many items) and each order gets counted once per item — so SUM(net_revenue_usd) adds it two or three times over. No error, just an inflated total. Pinning the view fixes this too.
Error 2 — Ask why, get a story instead of a diagnosis
The question: “Why did revenue drop 8% last week?”
What the model gives you: a paragraph. “Revenue is down because conversion fell on mobile, likely driven by the checkout change on Tuesday, with a secondary effect from lower paid traffic.”
It sounds like an analyst. It is not a diagnosis. The model didn’t decompose anything or test anything — it generated the most plausible-sounding explanation given the words in your question. Sometimes that story is right. Often it points at the wrong cause, and you can’t tell which time you’re in.
A real diagnosis is a search, not a story. And the search is just SQL.
Fix, step 1 — decompose the metric and find which factor moved.
Revenue ≈ orders × average order value. Before guessing why, find out what:
SELECT
  date_trunc('week', day)          AS week,
  COUNT(*)                         AS orders,
  SUM(net_revenue_usd)             AS revenue,
  SUM(net_revenue_usd) / COUNT(*)  AS aov
FROM finance.net_revenue_orders
WHERE day >= date '2026-05-11' AND day < date '2026-05-25'
GROUP BY 1
ORDER BY 1;
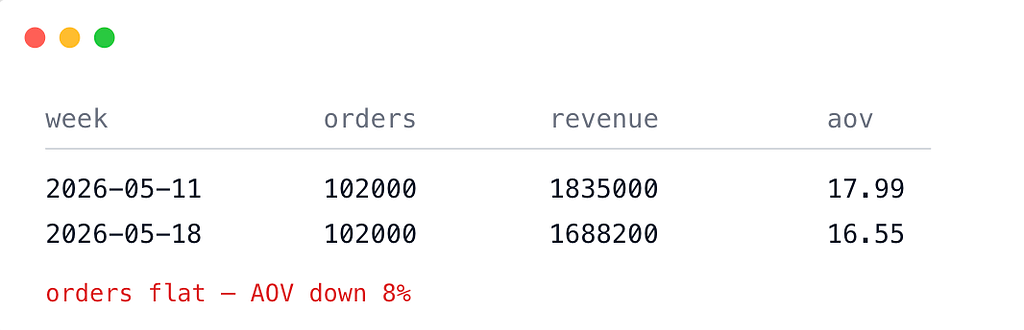
Orders barely moved. The whole drop is in basket size. You haven’t found the cause yet, but you’ve cut the problem in half — this is not a traffic or conversion problem, so the model’s “mobile conversion” story was wrong on step one.
Fix, step 2 — separate rate from mix (the trap that catches everyone).
Your AOV can fall while every city’s AOV holds steady — if your order mix shifted toward cheaper markets. Same paradox that makes an aggregate move in the opposite direction of all its parts.
SELECT
  city,
  COUNT(*) FILTER (
    WHERE day >= date '2026-05-11' AND day < date '2026-05-18') AS orders_wk1,
  COUNT(*) FILTER (
    WHERE day >= date '2026-05-18' AND day < date '2026-05-25') AS orders_wk2,
  AVG(net_revenue_usd) FILTER (
    WHERE day >= date '2026-05-11' AND day < date '2026-05-18') AS aov_wk1,
  AVG(net_revenue_usd) FILTER (
    WHERE day >= date '2026-05-18' AND day < date '2026-05-25') AS aov_wk2
FROM finance.net_revenue_orders
WHERE day >= date '2026-05-11' AND day < date '2026-05-25'
GROUP BY city
ORDER BY orders_wk2 DESC;
If per-city AOV is flat but a low-AOV city’s share of orders jumped, your “AOV dropped” is really “the mix shifted” — and the fix is a marketing/supply question, not a pricing one. The two diagnoses lead to opposite decisions. The decomposition tells them apart; the story doesn’t.
Fix, step 3 — only now ask why, and test it. Once you’ve localized the drop to a factor and a segment, you have a hypothesis (“a promo in the cheap-AOV city pulled mix down”). That you confirm with the data or an experiment — not with a paragraph.
This is the whole difference: the model free-associates one cause; the decomposition enumerates and isolates them. Three queries, fully reproducible, and you actually know.
Error 3 — Ask the same question twice, get two different answers
The test: run “why did revenue drop last week?” on Monday. Run it again Wednesday. Compare.
You can get two different numbers from the same question on the same data — even with the metric pinned. The cause is the model itself. Even at temperature zero, large models don’t reliably return identical output: floating-point addition isn’t associative, so different batch sizes and reduction orders across requests produce slightly different roundings, and providers document only best-effort determinism. The SQL it generates can shift run to run — a different join, a different filter — and out comes a different number.
(If the metric isn’t pinned, it gets worse — Monday’s run sums one definition, Wednesday’s another — but that’s Error 1 again. The failure unique to this one is that even a perfect, pinned query still sits on top of a non-deterministic model.)
For a creative task, who cares. For a number that drives a budget decision, this is disqualifying — you don’t have a measurement, you have one draw from a distribution. And the first time a stakeholder catches two different numbers for one question, the tool is dead, because nobody can tell which one was right.
The fix — make the metric deterministic code, and let the LLM only narrate it.
The number must come from a fixed, versioned definition — the view from Error 1, or a dbt model under version control — so it’s byte-identical every run, by anyone:
-- same query, same data => same answer, every time, forever
SELECT SUM(net_revenue_usd)
FROM finance.net_revenue_orders
WHERE day >= date '2026-05-11'
  AND day <  date '2026-05-18';
The LLM never computes the number. It picks which pinned metric and window you meant, a deterministic layer runs the math, and the model writes the sentence around the result. Run it a hundred times — same number, same decomposition. The narrative can vary; the measurement can’t.
So where does the LLM actually belong?
Not in the engine. On top of it.
The model is genuinely good as the interface and the narrator — wired over a deterministic core, not in place of one:
- Translate the question, don’t invent the answer. Natural language in → “you want net revenue, weekly, by city” out. The math runs on your pinned definitions.
- Suggest hypotheses, don’t confirm them. “Here are eight things that could move this metric” is a great use of a model that’s read everything. Which one is true is the decomposition’s job, and the experiment’s.
- Narrate the verified result. Once the SQL above produced a real, reproducible answer, having the model turn it into a clear paragraph for a stakeholder is genuinely useful. The narrative was never the problem — the narrative standing in for the analysis was.
Two questions cut through any “AI analyst” demo:
- Show me the same question, three times, on three days. If the numbers move, it’s a generator, not a measurement.
- When it’s wrong, how do I find out? If the answer is “the SQL would error,” good. If it’s a shrug, you’ve found the plausible-wrong-number machine.
The methods that pass that bar aren’t new or glamorous: pin the metric, decompose it, separate rate from mix, then test the cause. An LLM makes all four faster and friendlier. It just can’t replace them — and the moment you ask it to, it stops measuring and starts storytelling.
Three Ways an LLM on Your Warehouse Gets ‘Why Did Revenue Drop?’ Wrong-and How to Fix Each was originally published in Towards AI on Medium, where people are continuing the conversation by highlighting and responding to this story.
