
AI Inside the Monolith: Delivering a Lightweight, Modern UI for Oracle EBS with Zero Core Rewrite

The promise of generative AI in enterprise processes sounds incredibly appealing: a top executive types a question into a chat and instantly receives a precise analytical slice. In practice, however, attempting to connect a modern Large Language Model (LLM) directly to the “raw” database of a monolithic ERP system like Oracle E-Business Suite R12 usually ends in failure. The model hallucinates, confuses technical ledgers, or sends the database into an endless full table scan of terabyte-sized tables.
To solve this problem for large-scale enterprise systems, an architectural approach was developed that seamlessly integrates LLMs into the ERP landscape without rewriting legacy code or deploying heavy BI platforms. This is achieved by creating a lightweight semantic layer and adopting a Decoupled AI architecture.
Architectural Agility: The Semantic Layer as a Plugin
The key advantage of this approach is zero interference with the historical ERP core. Any large-scale updates carry inherent risks to the stability of running financial processes. In this case, the integration is executed as a lightweight plugin that runs in parallel and leaves standard Oracle EBS code completely untouched.
Instead of deploying massive intermediary platforms (such as the resource-intensive Oracle Enterprise Command Center infrastructure), this concept relies on leveraging the native SELECT AI syntax over a meticulously prepared semantic layer.
Direct AI access to physical database tables is strictly prohibited. Language models operate on business terms, whereas ERP systems store data in convoluted technical structures created decades ago (e.g., an invoice status in Oracle EBS might be calculated through a complex chain of conditions).
The semantic layer is a set of pre-configured virtual data marts housed directly within the database. All JOIN operations, system noise filtering, and translations of technical aliases into business concepts occur at the database level. As a result, the AI is placed in an isolated, comprehensible environment where it flawlessly generates optimal queries for instant analytics, effectively eliminating the risk of AI hallucinations.
Furthermore, this semantic abstraction elegantly resolves the challenge of heavily customized ERP environments. Instead of unraveling and rewriting decades-old PL/SQL packages containing unique business rules, the virtual data marts act as an abstraction wrapper. They encapsulate complex historical logic and present it to the AI as clean, unified entities. This guarantees that even the most intricate custom operational flows are accurately interpreted by the LLM without requiring any refactoring of the underlying legacy database objects.
Integration Variance: From Direct Access to REST APIs
A significant benefit of the Decoupled AI concept is its architectural flexibility. Depending on the client’s IT landscape and security policies, the transport layer can be implemented in two paradigms:
- Lightweight Integration (Direct Database Access): Provides the fastest Time-to-Market with minimal overhead. The external Progressive Web App (PWA) exchanges data directly via lightweight JSP/PLSQL gateways within the EBS itself.
- Service-Oriented Architecture (REST API): If the corporate IT strategy mandates strict system isolation, access to the AI semantic layer is wrapped in standardized REST services (e.g., via Oracle REST Data Services — ORDS).
The choice of the specific integration pattern is up to the customer’s architectural board, while the LLM’s operational logic and the PWA user experience remain consistently high.
Industry Context: The askEBS Alternative
When designing an intelligent interface for Oracle EBS, it is important to consider existing industry alternatives, specifically the askEBS concept. This is the vendor’s native solution, designed to operate within the original ecosystem. The choice between these architectural paths depends on the organization’s long-term IT strategy priorities:
- The Monolithic Path (askEBS): Relies on internal Oracle components and the traditional Enterprise Command Center (ECC) infrastructure. This approach is deeply integrated into standard modules and caters to organizations strictly adhering to the classic vendor roadmap.
- Decoupled Architecture (Decoupled AI Frontend): Offers an alternative, lightweight pattern. Maximum flexibility is achieved by completely separating the reactive PWA interface from the transactional core. This option is selected when key criteria include speed of implementation, zero infrastructural overhead, and, most importantly, the need for an advanced, “live” user experience: adaptive chats, dynamic bar charts, smart grids with conditional formatting, and instant interactive analytics.
The final choice of the architectural pattern always rests with the customer’s architectural board. The availability of market alternatives allows businesses to weigh infrastructure costs against interface agility requirements and make the most balanced, economically sound decision.
Seamless Integration and Enterprise Security
A critical challenge when modernizing interfaces is maintaining the familiar workspace while ensuring strict data control.
Entry Point: Launching from the Standard Oracle EBS Navigator Transitioning to the smart assistant interface does not require users to open third-party bookmarks or re-enter passwords. A custom quick-access icon is embedded directly into the standard Oracle EBS navigator menu. Upon clicking, the system generates a secure session token and opens the analytical hub in a new browser tab, ensuring the user’s ongoing transactional work in the ERP is uninterrupted.

Strict Access Control (Data-Level Security) Data security within the solution is inherited directly from Oracle EBS profile setups. Access to information is strictly confined to the specific user’s privileges at the Operating Unit level, balancing segments, and Virtual Private Database (VPD/Data Security) mechanisms. The AI model is physically incapable of “seeing” or aggregating documents that the user is not officially authorized to access in the ERP.
Zero Data Leakage: The Metadata-Only Architecture The primary security concern for any CTO regarding generative AI is the potential exposure of sensitive commercial data. It is critical to note that this architecture operates on a strict metadata-only paradigm. When a prompt is processed, the LLM receives only the structural database context (table schemas and business aliases) necessary to construct the SQL query. The actual financial records, supplier details, and transaction amounts never leave the corporate perimeter and are never transmitted to external AI providers. Query execution and data aggregation occur entirely within the secure, isolated confines of the Oracle Database.
Secure Mobile Access via DMZ The Decoupled AI architecture is inherently cross-platform. To provide mobile device access without compromising security, a classic Demilitarized Zone (DMZ) pattern is utilized.
A lightweight API gateway is exposed to the external perimeter (DMZ), isolating the corporate core and the ERP database from the public internet. Executives and operational staff can securely interact with analytics from their smartphones and tablets anywhere in the world, maintaining uncompromised enterprise protection.

Reactive Interface (PWA): Intelligent Data Visualization
Outputting financial reports as raw text arrays in a console no longer meets modern UX standards. The true value of the solution is unlocked through a flexible graphical interface that dynamically adapts data presentation to the specific ERP module and the user’s prompt.
The examples below represent only a baseline demonstration of possible use cases. The architectural flexibility of the semantic layer and the frontend allows for the design and visualization of absolutely any analytical slice in strict accordance with an organization’s unique business requirements. Furthermore, for in-depth offline analysis, a one-click “Export to Excel” feature is implemented out-of-the-box across all interfaces.
Dynamic visualization for key business domains:
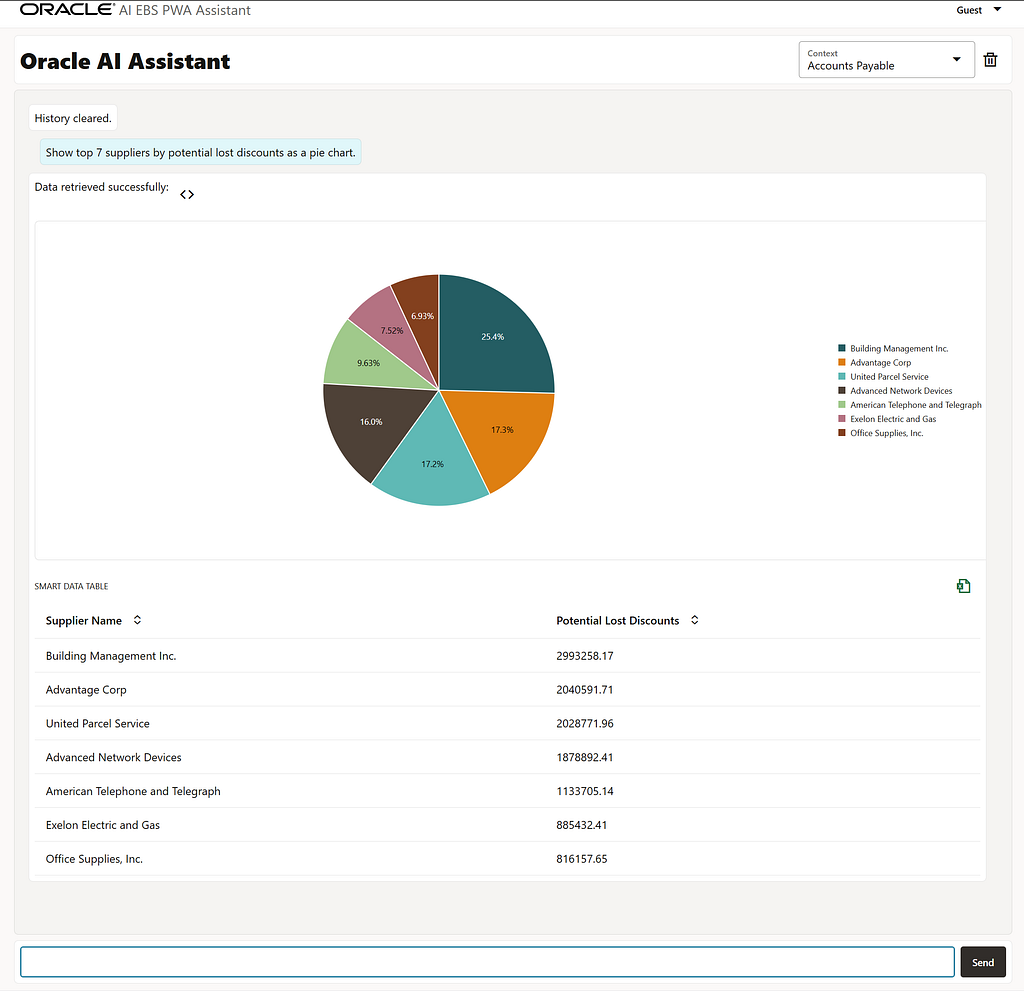
1. Accounts Payable (AP): Lost Discount Analytics
· User Prompt: “Show top 7 suppliers by potential lost discounts as a pie chart.”
· Visualization (Pie Chart + Smart Table): The component dynamically generates a responsive pie chart illustrating the distribution of potential financial losses among the top 7 suppliers. Percentage shares are cleanly embedded within each segment, with a clear legend aligned to the right. Below the chart, a Smart Data Table provides the exact monetary values, enabling financial controllers to instantly identify where the largest early payment savings are at risk.
2. Accounts Receivable (AR): Debt Control
· User Prompt: “Show top 10 customers. For each customer, select their max days overdue first, and then their total unpaid amount. Sort strictly by total unpaid amount descending.”
· Visualization (Descending Bar Chart + Smart Grid): The interface dynamically generates a clean, descending bar chart that automatically scales the Y-axis to millions, showcasing the absolute volume of outstanding debt per customer in a highly readable “staircase” pattern. Directly below, the interactive Smart Data Table provides immediate risk context. The “Max Days Overdue” column applies responsive traffic-light formatting — highlighting critical debts older than 60 days in deep red, mid-term warnings in orange, and safe zones under 30 days in green — while native horizontal data bars track the proportional weight of the unpaid balances.

3. Inventory (INV): Hidden Deficit Monitoring
· User Prompt: “Show top 10 items in Staging warehouse by total on-hand quantity. Include available to transact quantity.”
· Visualization (Bar Chart + Data Grid): The assistant dynamically renders a structured column chart plotting availability metrics across the top-tier items, using a clean, right-aligned legend to track specific parts. Below the chart, the system generates a comprehensive data table that displays the exact physical inventory balances (“Total On-Hand Quantity”) side-by-side with free stock (“Available To Transact”). This clear structural layout allows material planners to instantly identify operational bottlenecks — such as high-volume stock items (e.g., batteries) that are physically abundant but completely locked and unavailable for active transactions due to background system reservations.

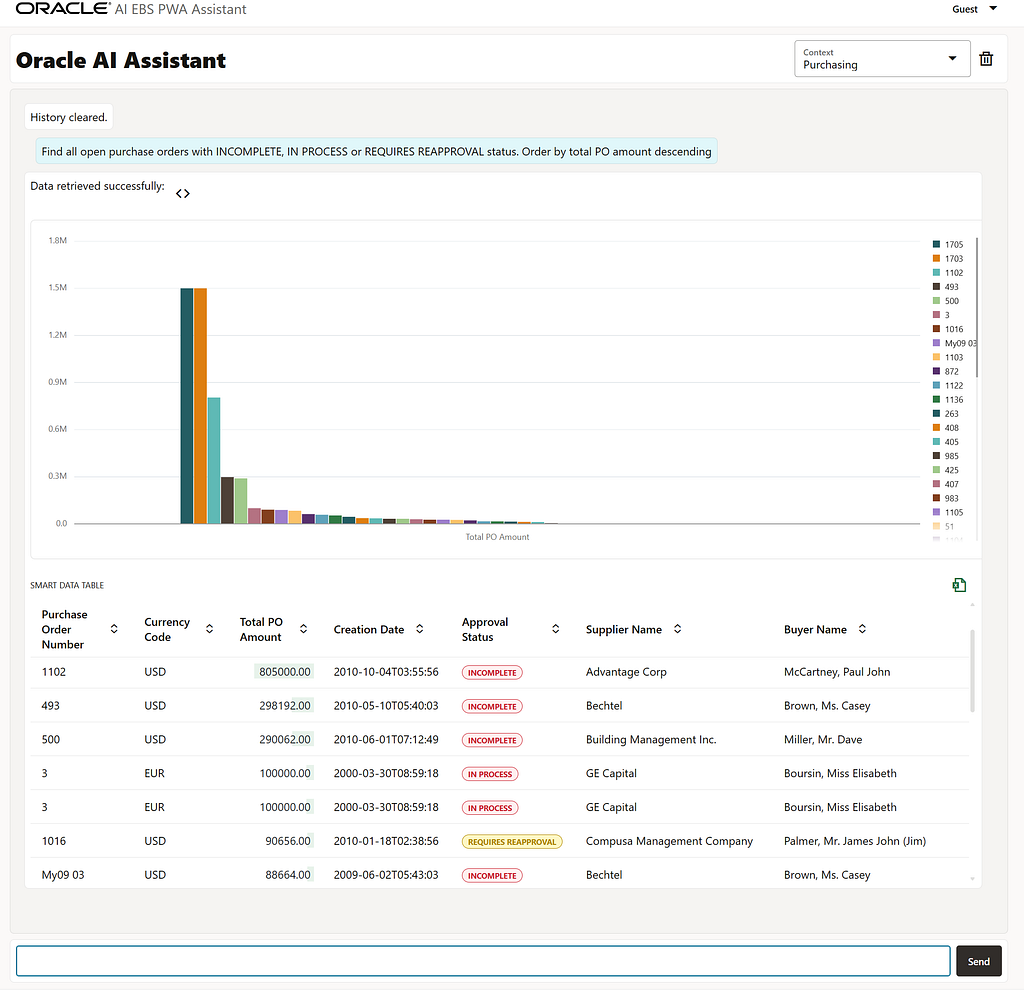
4. Purchasing (PO): Order Status Tracking
· User Prompt: “Find all open purchase orders with INCOMPLETE, IN PROCESS or REQUIRES REAPPROVAL status. Order by total PO amount descending”
· Visualization (Descending Bar Chart + Smart Table with Status Badges): The system dynamically generates a descending bar chart to instantly rank open contracts by financial exposure, paired with a detailed tactical data grid below. The “Approval Status” column automatically transforms dry, uppercase database text into contrasting, softly-filled colored badges. Critical INCOMPLETE and IN PROCESS states are bordered in warning red, while orders that REQUIRES REAPPROVAL are highlighted in amber. This allows procurement managers to immediately scan the grid and pinpoint high-value contracts “stuck” in the approval pipeline without reading through row level logs.
5. General Ledger (GL): Trial Balance & Financial Formatting
- User Prompt: “Show ending balances grouped by Vision Operations (USA) ledger, company 01, natural account for the Oct-09 period, excluding zero balances. Order by natural account as a bar chart.”
- Visualization (Diverging Bar Chart + Smart Grid with Accounting Format): The interactive component renders a diverging bar chart that clearly demonstrates the distribution of debit (upward) and credit (downward) balances relative to the zero axis, reflecting the true volume of account balances. However, the core value is revealed within the data grid: the system automatically detects the GL context and applies strict international accounting formatting standards. Positive amounts are accompanied by clean green Data Bars, while negative credit balances are enclosed in classic red parentheses — for instance, (21976.77). This enables financial controllers to analyze the Trial Balance in its familiar, native format directly within the web interface, eliminating the need to export raw data into Excel.

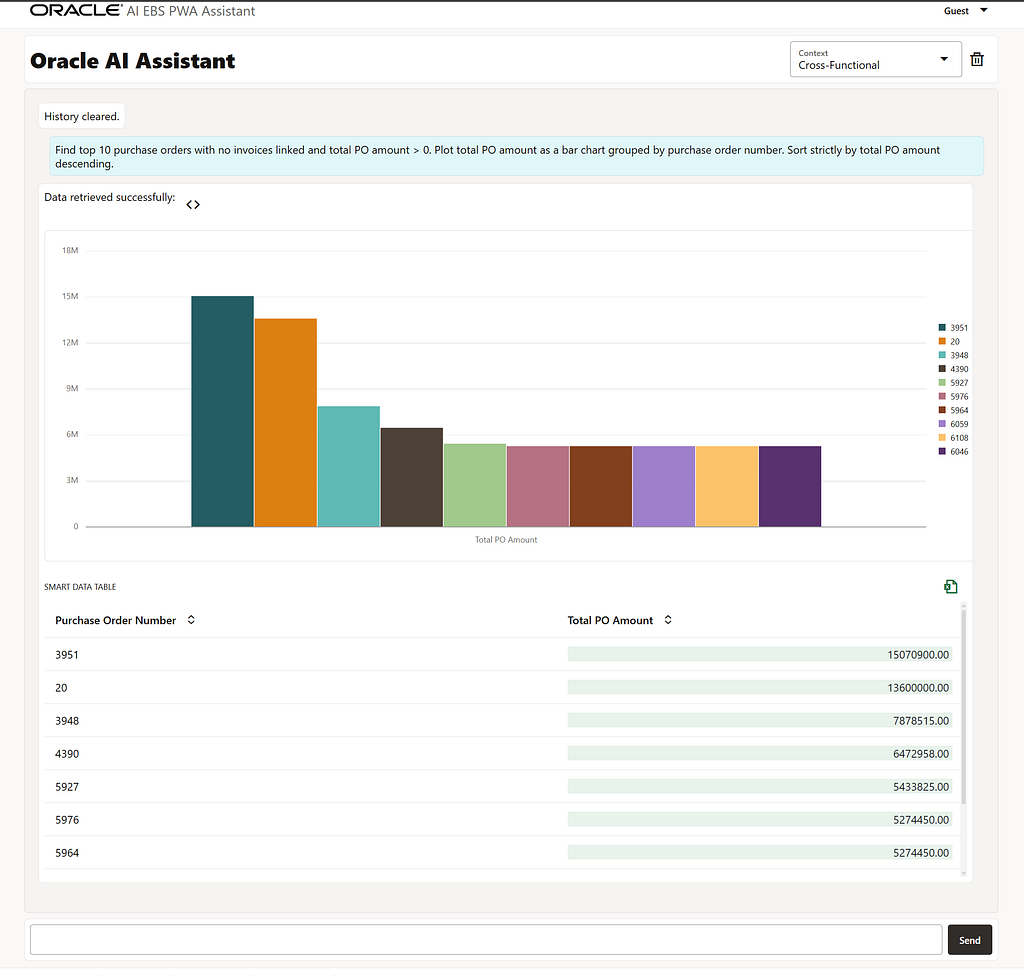
6. Cross-Functional: Open Commitments (Uninvoiced POs)
- User Prompt: “Find top 10 purchase orders with no invoices linked and total PO amount > 0. Select Supplier Name concatenated with Purchase Order Number as one text column first (separate by “: “), then Total PO Amount, and Purchase Order Date. Sort strictly by total PO amount descending as a bar chart.”
- Visualization (Descending Bar Chart + Rich Data Grid): This cross-functional use case elegantly merges Purchasing and Payables data to monitor hidden financial obligations. The interface generates a strict descending bar chart, visualizing the top uninvoiced orders as a financial cascade. The intelligent smart grid below leverages concatenation to deliver rich context (Supplier Name + PO Number) within a single column, while the financial figures are reinforced by embedded horizontal Data Bars. This equips the CFO with a powerful visual tool to instantly evaluate upcoming cash outflows without the tedious process of manually reconciling data across disparate ERP modules.
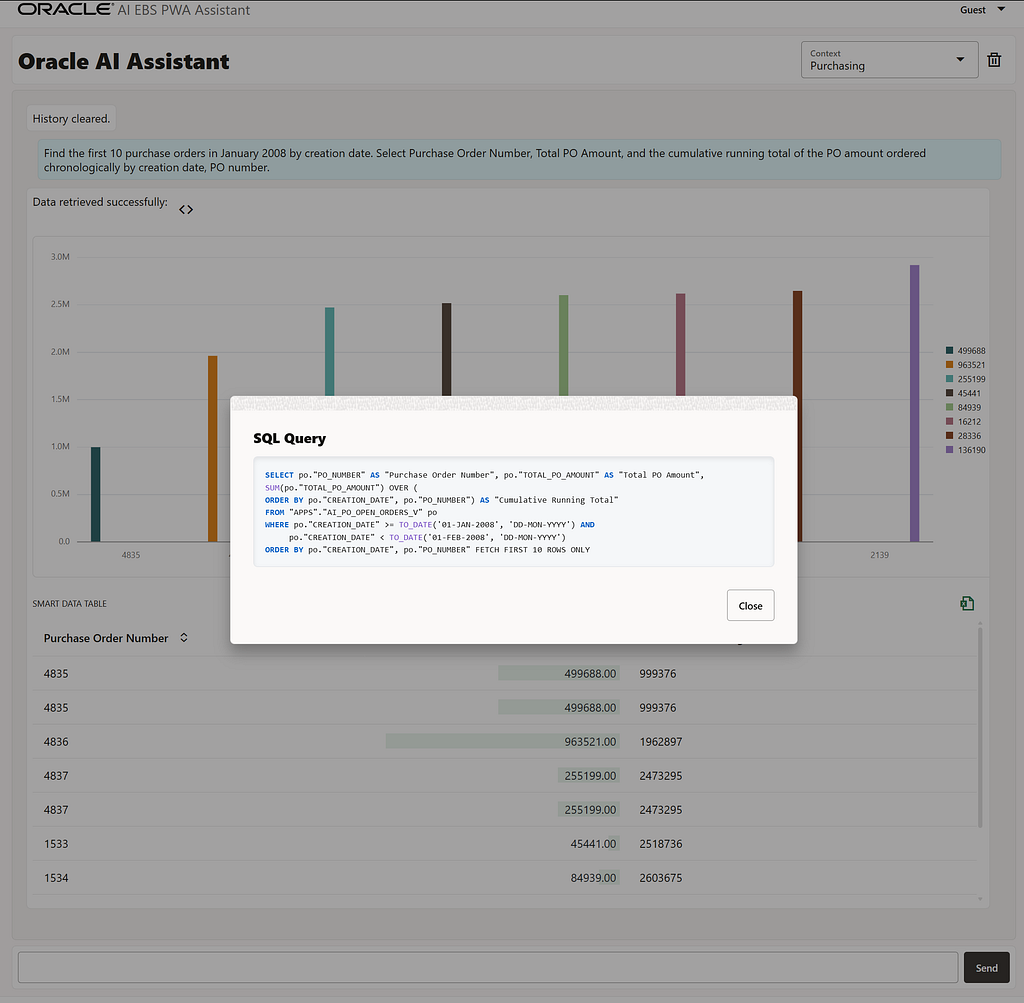
7. Advanced Analytics: AI Generating Window Functions
· User Prompt: “Find the first 10 purchase orders in January 2008 by creation date. Select Purchase Order Number, Total PO Amount, and the cumulative running total of the PO amount ordered chronologically by creation date, PO number.”
· Under the Hood (SQL Generation): To demonstrate that the assistant is not just a rudimentary text-to-SQL wrapper, we inspected the generated payload. The LLM flawlessly implements an advanced Oracle Window Function, generating a clean SUM(“TOTAL_PO_AMOUNT”) OVER (ORDER BY “CREATION_DATE”, “PO_NUMBER”) clause. Notably, the generation correctly handles deterministic sorting by including the PO Number, preventing calculation batching issues with identical timestamps. This seamless integration of complex SQL logic directly within a modern Progressive Web App (PWA) showcases a truly user-oriented solution—delivering enterprise-grade analytical processing to the end-user without requiring them to write a single line of code.
Conclusion
Deploying an LLM via the Decoupled AI approach as a lightweight plugin delivers fundamentally new economic and operational metrics:
- Business Process Safety (Zero-rewrite): The risk of disrupting the transactional core is completely eliminated, as the standard Oracle EBS codebase remains unaltered.
- Cost Optimization (Infrastructural Lean): There is no need to purchase expensive server hardware or additional client licenses for heavy BI platforms — computations are optimized within the existing database perimeter, and users operate via a lightweight frontend.
- Accelerated Time-to-Value: The time required to prepare complex, multidimensional management reports is reduced from several days to a mere 5-second dialogue with an AI assistant.
Implementing this pattern breathes new life into a monolithic system, providing it with a modern, intuitive interface and transforming terabytes of accumulated data into a secure, transparent tool for operational decision-making.
The future of enterprise software is already knocking on your door. Are you ready for it, or is your CFO still waiting for that report export?
Dmitry Borisov Oracle Solution Architect | Oracle ACE
Disclaimer: The architectural patterns, SQL queries, and AI integrations described in this article were developed and tested exclusively within the official Oracle E-Business Suite Vision demonstration environment and Oracle Database Free/Developer editions. These environments are strictly intended for educational, prototyping, and Proof-of-Concept (PoC) purposes. No production systems, commercial instances, or real proprietary business data were used, modified, or exposed during this research.
AI Inside the Monolith: Delivering a Lightweight, Modern UI for Oracle EBS with Zero Core Rewrite was originally published in Towards AI on Medium, where people are continuing the conversation by highlighting and responding to this story.