
How Our AI Inference Cluster Almost Lost a $20K/Month Client
What a GPU memory leak and missing circuit breakers taught us about production AI infrastructure.
I’m going to tell you about the worst fifteen minutes of my professional life first. Then I’m going to show you exactly what I built so it never happens again.
The demo was for a room full of enterprise stakeholders. One of those moments where six months of work gets judged in thirty minutes. Our multi-model pipeline three models running in sequence on Triton, orchestrated through Ray Serve, sitting on EKS, had been rock solid in staging for two weeks. We’d run load tests. We’d done dry runs. Everything was fine.
Two minutes in, requests started hanging.
Not erroring. Hanging. Which is actually worse because for a moment you think it’s just slow, maybe a cold start, maybe network blip. You give it another thirty seconds. Still hanging. You open your laptop under the table and pull up CloudWatch and the GPU utilization graph is flatlined and your stomach drops because you know what a flatlined GPU graph means and it doesn’t mean everything is fine.
The cluster wasn’t down. The pods were running. Kubernetes was perfectly happy. Triton was up. Ray was up. Everything was up and nothing was working and there were fifteen people in that room watching a loading spinner.
That incident taught me more about enterprise AI infrastructure than the previous two years combined. Here’s what I actually learned and what I built after.
The Architecture Before and After
This is what the system looked like before the incident , and what it looks like now. The difference is everything that sits between a request arriving and a model touching it.
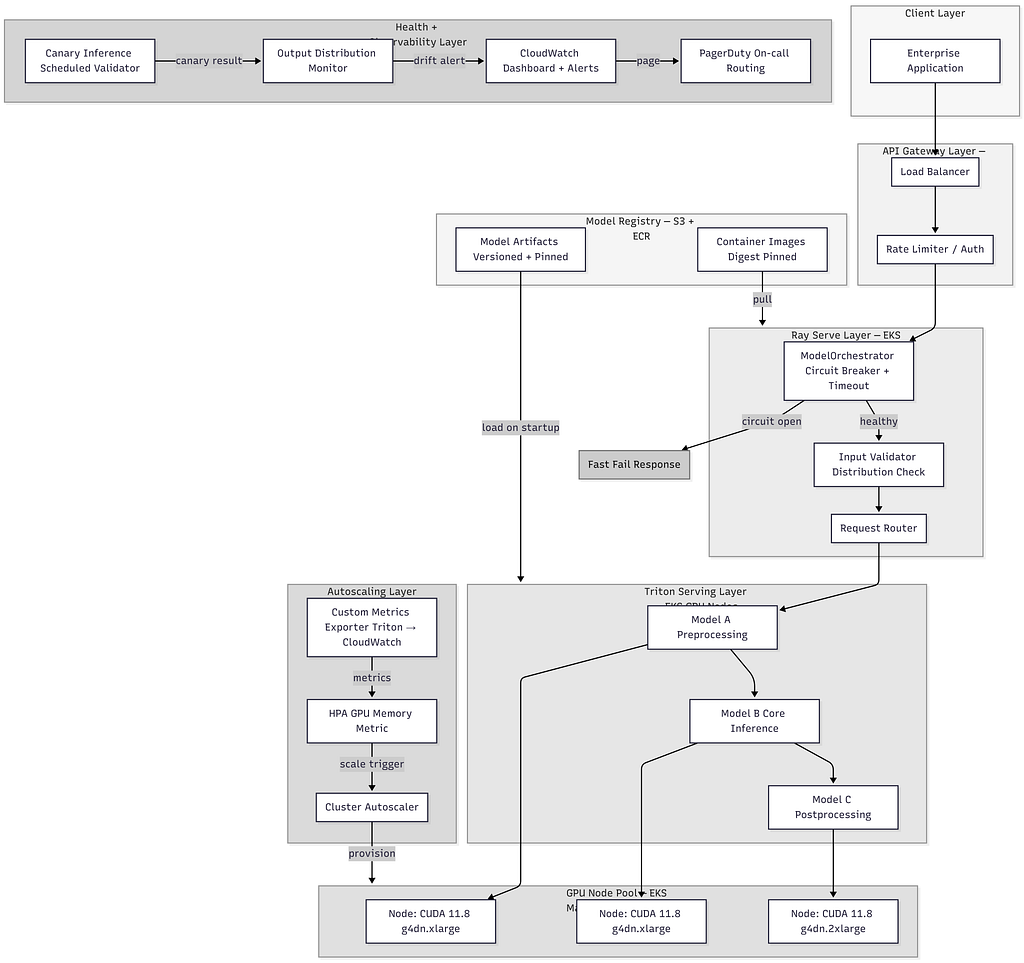
Every box in that diagram exists because something broke in production. The circuit breaker because of hanging requests. The canary validator because of a silent bad model load. The CUDA version pinning on the node group because of floating point drift nobody noticed for days. The output distribution monitor because a dependency update changed model behavior and a human caught it before the system did, which is not a situation you want to repeat.
Let me walk through what each layer actually does and why.
What Actually Happened
Before the fix, the diagnosis.
The root cause took us three hours to fully trace after the demo. We had a GPU memory leak in one of the Triton model instances that had been accumulating slowly across dry runs. By demo time the memory was fragmented enough that new inference requests were queuing waiting for allocation that never came. No OOM error. No crash. Just silent starvation. Pods healthy. Models loaded. GPU quietly suffocating.
The second problem was that our health checks had no idea. They were checking HTTP 200 from the Triton health endpoint. Triton was healthy. The GPU was not. Those are two different things and we were only checking one of them.
The third problem was our Ray Serve deployment had no circuit breaking. When Triton stopped responding to inference requests, Ray kept accepting new ones and queuing them. The queue grew. Requests hung. Users saw a spinner. Nobody upstream knew why.
Three separate failure modes, all hitting simultaneously, none of them individually catastrophic but together completely fatal.
The Architecture Rewrite
After the incident I got two weeks to fix it properly. Here’s what I actually built.
1. Real Health Checks That Exercise the Model
The first thing I threw out was the HTTP health check. Replaced it with something that actually validates the model is serving correctly.
import tritonclient.http as httpclient
import numpy as np
from typing import Optional
import logging
logger = logging.getLogger(__name__)
class ModelHealthValidator:
    def __init__(
        self,
        triton_url: str,
        model_name: str,
        model_version: str = "1",
        timeout_seconds: float = 5.0
    ):
        self.client = httpclient.InferenceServerClient(
            url=triton_url,
            verbose=False
        )
        self.model_name = model_name
        self.model_version = model_version
        self.timeout = timeout_seconds
        self.expected_output_hash = self._load_expected_hash()
    def is_healthy(self) -> tuple[bool, Optional[str]]:
        try:
            if not self.client.is_server_live():
                return False, "server not live"
            if not self.client.is_model_ready(self.model_name):
                return False, f"model {self.model_name} not ready"
            result = self._run_canary_inference()
            if not result:
                return False, "canary inference failed or output mismatch"
            stats = self.client.get_inference_statistics(self.model_name)
            if not self._check_gpu_headroom(stats):
                return False, "insufficient GPU memory headroom"
            return True, None
        except Exception as e:
            return False, str(e)
    def _run_canary_inference(self) -> bool:
        # Fixed test input - same every time, output is deterministic
        test_input = np.zeros((1, 512), dtype=np.float32)
        inputs = [httpclient.InferInput("input_ids", test_input.shape, "FP32")]
        inputs[0].set_data_from_numpy(test_input)
        outputs = [httpclient.InferRequestedOutput("output")]
        result = self.client.infer(
            model_name=self.model_name,
            inputs=inputs,
            outputs=outputs,
            timeout=self.timeout
        )
        output_hash = self._hash_output(result.as_numpy("output"))
        return output_hash == self.expected_output_hash
This runs on every readiness probe. Not just “is the server up” but “did the model produce the right output for a known input.” The hash comparison catches the case where the model loaded incorrectly or a dependency change shifted numerical outputs. Caught two issues in the month after we deployed it. Neither would have surfaced until a user hit a bad result.
2. Circuit Breaking at the Ray Layer
The hanging requests problem was a Ray Serve configuration problem. We weren’t protecting ourselves from a degraded downstream.
from ray import serve
from ray.serve.handle import DeploymentHandle
import asyncio
import time
from collections import deque
from typing import Any
import logging
logger = logging.getLogger(__name__)
class CircuitState:
    CLOSED = "closed"
    OPEN = "open"
    HALF_OPEN = "half_open"
@serve.deployment(
    num_replicas=2,
    ray_actor_options={"num_gpus": 0},
    health_check_period_s=10,
    health_check_timeout_s=30,
)
class ModelOrchestrator:
    def __init__(self, triton_handle: DeploymentHandle):
        self.triton = triton_handle
        self.state = CircuitState.CLOSED
        self.failure_count = 0
        self.failure_threshold = 5
        self.recovery_timeout = 30.0
        self.last_failure_time: float = 0
        self.recent_latencies = deque(maxlen=100)
    async def __call__(self, request_data: dict) -> Any:
        if self.state == CircuitState.OPEN:
            if time.time() - self.last_failure_time > self.recovery_timeout:
                self.state = CircuitState.HALF_OPEN
                logger.info("Circuit half-open, testing recovery")
            else:
                raise RuntimeError(
                    "Service temporarily unavailable. Circuit open."
                )
        try:
            start = time.time()
            result = await asyncio.wait_for(
                self.triton.infer.remote(request_data),
                timeout=10.0  # Hard timeout - no more silent hanging
            )
            latency = time.time() - start
            self.recent_latencies.append(latency)
            self._on_success()
            return result
        except asyncio.TimeoutError:
            self._on_failure("inference timeout")
            raise RuntimeError("Inference timeout after 10s")
        except Exception as e:
            self._on_failure(str(e))
            raise
    def _on_success(self):
        if self.state == CircuitState.HALF_OPEN:
            logger.info("Circuit closed - service recovered")
        self.failure_count = 0
        self.state = CircuitState.CLOSED
    def _on_failure(self, reason: str):
        self.failure_count += 1
        self.last_failure_time = time.time()
        logger.warning(
            f"Failure {self.failure_count}/{self.failure_threshold}: {reason}"
        )
        if self.failure_count >= self.failure_threshold:
            if self.state != CircuitState.OPEN:
                logger.error("Circuit OPEN - failing fast")
            self.state = CircuitState.OPEN
The critical thing here is the hard timeout on asyncio.wait_for. That’s what kills the hanging request problem. You’d be surprised how many production Ray deployments I’ve seen with no timeout at all on the downstream call. It works fine until it doesn’t and then it’s fifteen people watching a spinner.
3. GPU Autoscaling That Actually Understands Models
The standard Kubernetes HPA scales on CPU and memory. GPU workloads laugh at CPU metrics. A model can be completely saturated on GPU while CPU sits at 15% and HPA thinks everything is fine and doesn’t scale.
import boto3
import tritonclient.http as httpclient
import time
from dataclasses import dataclass
from typing import Optional
import logging
logger = logging.getLogger(__name__)
@dataclass
class TritonMetrics:
    gpu_utilization: float
    gpu_memory_used_bytes: int
    gpu_memory_total_bytes: float
    queue_depth: int
    avg_inference_latency_ms: float
    request_success_rate: float
class TritonMetricsExporter:
    def __init__(
        self,
        triton_url: str,
        model_name: str,
        cloudwatch_namespace: str,
        cluster_name: str,
        deployment_name: str
    ):
        self.triton = httpclient.InferenceServerClient(url=triton_url)
        self.model_name = model_name
        self.cw = boto3.client("cloudwatch", region_name="us-east-1")
        self.namespace = cloudwatch_namespace
        self.dimensions = [
            {"Name": "ClusterName", "Value": cluster_name},
            {"Name": "DeploymentName", "Value": deployment_name},
        ]
    def collect_and_publish(self) -> Optional[TritonMetrics]:
        try:
            stats = self.triton.get_inference_statistics(self.model_name)
            model_stats = stats["model_stats"][0]["inference_stats"]
            success = model_stats["success"]["count"]
            fail = model_stats["fail"]["count"]
            total = success + fail
            success_rate = success / total if total > 0 else 1.0
            queue_ns = model_stats["queue"]["ns"]
            queue_count = model_stats["queue"]["count"]
            avg_queue_ms = (
                queue_ns / queue_count / 1e6
            ) if queue_count > 0 else 0
            metrics = TritonMetrics(
                gpu_utilization=self._get_gpu_utilization(),
                gpu_memory_used_bytes=self._get_gpu_memory_used(),
                gpu_memory_total_bytes=self._get_gpu_memory_total(),
                queue_depth=queue_count,
                avg_inference_latency_ms=avg_queue_ms,
                request_success_rate=success_rate
            )
            self._publish_to_cloudwatch(metrics)
            return metrics
        except Exception as e:
            logger.error(f"Failed to collect metrics: {e}")
            return None
    def _publish_to_cloudwatch(self, metrics: TritonMetrics):
        memory_utilization = (
            metrics.gpu_memory_used_bytes /
            metrics.gpu_memory_total_bytes * 100
            if metrics.gpu_memory_total_bytes > 0 else 0
        )
        self.cw.put_metric_data(
            Namespace=self.namespace,
            MetricData=[
                {
                    "MetricName": "GPUMemoryUtilization",
                    "Value": memory_utilization,
                    "Unit": "Percent",
                    "Dimensions": self.dimensions
                },
                {
                    "MetricName": "InferenceQueueDepth",
                    "Value": metrics.queue_depth,
                    "Unit": "Count",
                    "Dimensions": self.dimensions
                },
                {
                    "MetricName": "AvgInferenceLatencyMs",
                    "Value": metrics.avg_inference_latency_ms,
                    "Unit": "Milliseconds",
                    "Dimensions": self.dimensions
                },
            ]
        )
Then the HPA manifest that scales on GPU memory instead of CPU:
apiVersion: autoscaling/v2
kind: HorizontalPodAutoscaler
metadata:
  name: triton-inference-hpa
  namespace: ml-serving
spec:
  scaleTargetRef:
    apiVersion: apps/v1
    kind: Deployment
    name: triton-inference-server
  minReplicas: 2
  maxReplicas: 8
  metrics:
  - type: External
    external:
      metric:
        name: GPUMemoryUtilization
        selector:
          matchLabels:
            deployment: inference-service
      target:
        type: AverageValue
        averageValue: "70"
  - type: External
    external:
      metric:
        name: InferenceQueueDepth
        selector:
          matchLabels:
            deployment: inference-service
      target:
        type: AverageValue
        averageValue: "10"
  behavior:
    scaleUp:
      stabilizationWindowSeconds: 60
      policies:
      - type: Pods
        value: 2
        periodSeconds: 60
    scaleDown:
      stabilizationWindowSeconds: 300
The stabilizationWindowSeconds: 300 on scale down is important. GPU pods take time to warm up. Scale down aggressively and then traffic spikes and you’re scrambling on cold starts during a burst. Better to overprovision for five minutes.
The CUDA Mismatch Problem
Two node groups in EKS. Majority running CUDA 11.8. A small batch of newer nodes with CUDA 12.1 from a routine upgrade. Same AMI family, different driver baked in. Nobody announced it loudly.
TensorRT-optimized models are sensitive to this. The model doesn’t crash. It runs. It just produces outputs with slightly different floating point behavior. We caught it because output distribution monitoring flagged a shift. Not a big shift. But enough.
# Label nodes explicitly during provisioning
kubectl label nodes <node-name> cuda-version=11.8

# Or automate in EKS node group launch template user data
CUDA_VERSION=$(nvidia-smi | grep "CUDA Version" | awk '{print $9}')
kubectl label node $(hostname) cuda-version=$CUDA_VERSION
spec:
  template:
    spec:
      nodeSelector:
        cuda-version: "11.8"  # Pin to validated CUDA version
      containers:
      - name: triton-inference-server
        # Pinned digest, not tag — tags are mutable and will betray you
        image: nvcr.io/nvidia/tritonserver@sha256:a1b2c3d4e5f6...
Obvious in retrospect. You pin library versions in requirements.txt but forget the driver version on the metal underneath. The container boundary gives you false confidence.
What I Monitor Now
Output distribution monitoring, baseline mean and p95 of model output scores over a 24 hour healthy window. Alert on two standard deviation shift. Catches silent degradation before users notice.
GPU memory fragmentation, not just memory used, but trend over time. A slow leak looks like a gradual upward climb in memory with flat utilization. Memory climbing without request volume climbing means something is accumulating.
Canary inference latency, same fixed test input runs on a schedule, latency tracked over time. Drift on a fixed input with no load change means the environment changed.
Queue depth per model, in a multi-model pipeline, one slow model backs up the whole chain. Knowing which model’s queue is growing tells you exactly where to look without digging through logs first.
The Thing I Actually Learned
The demo incident wasn’t bad luck. It was a system designed to fail silently and it succeeded at exactly that.
Kubernetes tells you pods are running. Triton tells you the server is healthy. Neither knows if your model is doing its job. That gap is yours to fill. Nobody gives you that monitoring. You build it deliberately or you find out it’s missing in the worst possible moment.
Three years doing this at enterprise scale and the thing that separates infra that holds from infra that doesn’t isn’t the serving framework or the model architecture. It’s whether you were paranoid enough about failure modes before they happened.
The demo cluster has been running under real production load for eight months since the rewrite. The circuit breaker has fired twice. The health checks caught one bad model load before it hit a user. The autoscaler has handled 4x traffic spikes without a page.
None of that is magic. It’s the stuff you build after watching fifteen people stare at a loading spinner in a conference room and feeling responsible for every second of it.
Build the paranoia in first.
I’m Manasa, I’ve spent the last 3+ years designing and running large scale distributed systems, AI/ML infrastructure, cloud architecture on AWS and more. I enjoy hard engineering problems regardless of the stack, backend, platform, infrastructure, full stack, whatever the problem actually needs. If you’re building something interesting or have a role you think I’d be a fit for, I’d genuinely love to hear from you. Find me on LinkedIn — I respond to everyone.
How Our AI Inference Cluster Almost Lost a $20K/Month Client was originally published in Towards AI on Medium, where people are continuing the conversation by highlighting and responding to this story.