
When Accuracy Lies: A Rigorous Machine Learning Approach to Credit Card Fraud Detection

Benchmarking five classifiers on one of the most imbalanced datasets in data science, and learning why the metrics you choose matter more than the model you pick.
Table of Contents
Introduction
- The Problem: Why Fraud Detection Is Hard
- Key Design Decisions Before Writing a Single Line of Model Code
- Exploratory Data Analysis
- Preprocessing: Keeping It Clean
- The Five Classifiers
- Validation Strategy
- Results: What the Numbers Actually Say
- XGBoost Feature Importances
- Key Takeaways
- What Comes Next
Conclusion
Introduction
Imagine building a fraud detection model that achieves 99.83% accuracy on its first run. Impressive, right? Now imagine discovering that this model never flagged a single fraud, it simply predicted “legitimate” for every transaction, and happened to be correct 99.83% of the time due to the extreme rarity of fraud in the data.
This is not a hypothetical. It is exactly what happens when standard machine learning workflows are applied naively to the credit card fraud detection problem, and it is the central challenge this project was built to address.
In this article, I walk through an end-to-end ML comparison project that benchmarks five classifiers on the ULB Credit Card Fraud Detection dataset. The goal is not just to build a model that detects fraud, it is to build one correctly, with the right metrics, the right validation strategy, and an honest understanding of what the numbers actually mean.
To tackle this problem, five supervised learning algorithms are put to the test: Decision Tree, K-Nearest Neighbours (KNN), Linear SVM, Random Forest, and XGBoost. Each represents a different family of machine learning approaches, from simple interpretable trees to powerful gradient-boosted ensembles, allowing for a meaningful and well-rounded comparison.
1. The Problem: Why Fraud Detection Is Hard
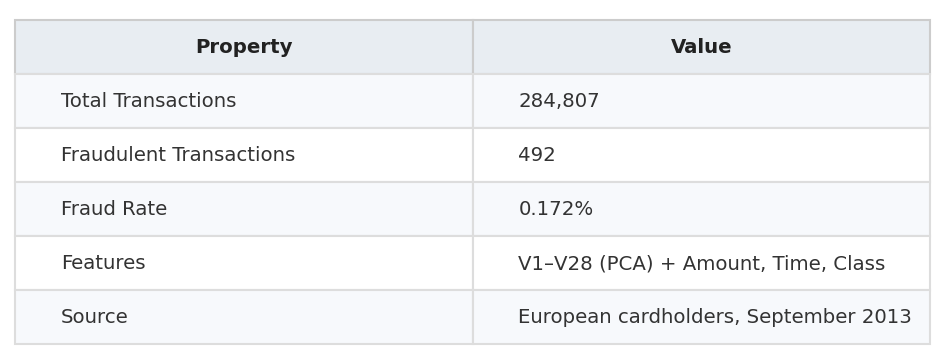
The dataset used in this project contains 284,807 credit card transactions made by European cardholders over two days in September 2013. Of those, only 492 are fraudulent, representing just 0.172% of all transactions.
This is what practitioners call a severely imbalanced classification problem. The two classes are so unequal that standard training procedures, default thresholds, and common metrics all behave in misleading ways. A model optimised for accuracy will learn to ignore fraud entirely, because ignoring it is the path of least resistance.
The 28 features in the dataset ( V1 through V28 ) are the result of a PCA transformation applied by the original authors to protect cardholder privacy. Only the Amount and Time columns retain their original scale, making feature engineering relatively constrained. This mirrors a common real-world constraint: you rarely get clean, interpretable raw features in financial data.
Dataset at a glance :
This project uses the publicly available ULB Credit Card Fraud Detection dataset
2. Key Design Decisions Before Writing a Single Line of Model Code
One of the most valuable aspects of this project is that every design decision is made deliberately, before any model is trained.
Here is a summary of the choices that matter most:
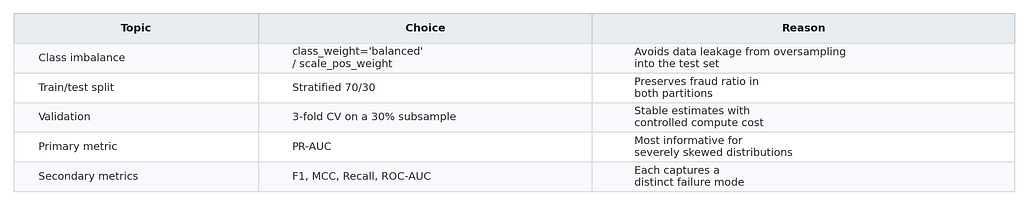
The most consequential of these is the choice of PR-AUC as the primary metric. Most tutorials on this dataset default to ROC-AUC, which sounds reasonable, but in highly imbalanced settings, ROC curves can be dangerously optimistic.
A model can score a high ROC-AUC while still missing the majority of actual frauds. Precision-Recall curves, by contrast, directly measure how well the model performs on the minority class, which is the only class that matters operationally.
3. Exploratory Data Analysis
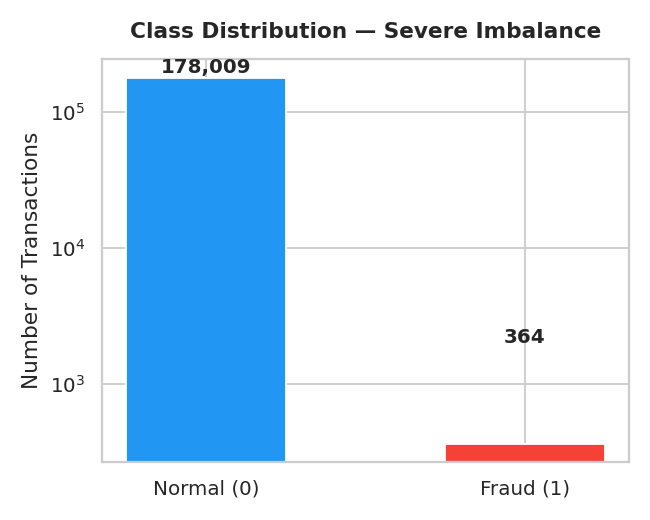
Before modelling, a focused EDA reveals two important patterns.
First, the class distribution chart confirms the imbalance visually on a log scale. The difference between Normal and Fraud is not slight, it is structural. Any model that does not account for it will fail silently.
Second, looking at transaction amounts split by class reveals that fraud transactions tend to cluster at lower amounts, while legitimate transactions show a much wider and higher distribution. This is consistent with real-world fraud behaviour, where small-value transactions are often used to test stolen card credentials.

4. Preprocessing: Keeping It Clean
The preprocessing pipeline is deliberately minimal and leakage-free:
- Duplicate rows are dropped before splitting.
- The Time column is removed, it carries no useful signal for most classifiers in this context.
- StandardScaler is applied to the Amount column only, since V1-V28 are already PCA-scaled.
- The data is then split using a stratified 70/30 train-test split, which guarantees that the fraud ratio is preserved in both the training and test sets.
An optional SMOTE oversampling block is included in the notebook (commented out), allowing experimentation with synthetic minority oversampling without disrupting the main pipeline.
5. The Five Classifiers
Five models are included in the benchmark, each configured to handle class imbalance explicitly :

A key engineering choice here is the use of LinearSVC wrapped in CalibratedClassifierCV instead of the standard kernel SVM. This is 10–100x faster on a dataset of this size while producing comparable results and, crucially, outputting probability scores needed for ROC and PR curve computation.
KNN is included deliberately as a near-naive baseline. Its absence of imbalance correction makes it a useful reference point: if a model cannot outperform KNN on PR-AUC, something is wrong.
6. Validation Strategy
Before final evaluation, each model is assessed via 3-fold stratified cross-validation on a 30% stratified subsample of the training set. This approach balances three considerations:
- Honesty :CV scores are more reliable than a single train/test split.
- Speed : A 30% subsample keeps runtime manageable without sacrificing statistical stability.
- Fairness : Stratification ensures the fraud ratio is preserved in every fold.
CV scores are reported as mean ± standard deviation across folds for F1, ROC-AUC, PR-AUC, Recall, and Precision.
7. Results: What the Numbers Actually Say
After cross-validation, each model is trained on the full training set and evaluated on the held-out test set across seven metrics.

A few patterns emerge immediately:
Recall is where the real differences show. A missed fraud is a financial loss. Models that sacrifice recall for precision may look good on paper but fail operationally. This is where the importance of the full metric suite becomes clear a model with high accuracy and low recall is worse than useless in a fraud context.
PR-AUC separates the strong models from the weak ones more clearly than ROC-AUC. The ROC curves for all five models cluster near the top of the plot, making it difficult to distinguish them.

The PR curves tell a more honest story. The gap between the best and worst performing models is far more visible, and the baseline (the fraud prevalence line) serves as a meaningful anchor for what “no better than random” actually looks like on this problem.

Matthews Correlation Coefficient (MCC) is the most conservative of the metrics included. Unlike F1, it accounts for all four cells of the confusion matrix and remains meaningful even when class sizes are extremely unequal. A model with a high MCC has genuinely learned the structure of both classes, it cannot inflate its score by exploiting the imbalance.
The normalised confusion matrices make the per-class performance of each model immediately readable:

Metrics reference guide :

8. XGBoost Feature Importances
Among the five models, XGBoost provides the additional benefit of built-in feature importance scores. The top 15 features by mean gain reveal which PCA components carry the most discriminative signal for fraud classification.

While the PCA transformation prevents direct interpretation of what these features represent in the original feature space, the importance ranking is still actionable: it tells practitioners where the model is “looking” when it flags a transaction, and it can inform feature selection decisions in downstream pipelines.
9. Key Takeaways
This project reinforces several lessons that apply well beyond fraud detection:
1. Accuracy is not a metric for imbalanced problems. It should be reported for completeness, but never used to select or compare models when class distributions are skewed.
2. Choose your primary metric before you train anything. The metric you optimise shapes every subsequent decision. PR-AUC is the right default for minority-class detection problems.
3. Imbalance handling does not require oversampling. class_weight=’balanced’ and scale_pos_weight are clean, leakage-free alternatives that work well in practice.
4. Cross-validation scores and test scores should tell the same story. Large gaps between CV and test performance are a signal of overfitting or data leakage, not good luck.
5. MCC is underused. For any binary classification problem with imbalanced classes, MCC should be a standard part of the evaluation suite alongside F1 and AUC.
10. What Comes Next
Beyond benchmarking, this comparison serves a practical purpose:
- Identifying which algorithms are best suited to the fraud detection problem provides a concrete foundation for building and deploying a real-world system.
- The top-performing models identified here ranked by PR-AUC, Recall, and MCC are the natural candidates to carry forward into a production pipeline, where factors such as inference speed, explainability, and integration cost will further refine the final choice.
- On the modelling side, the next steps include hyperparameter optimisation with Optuna, leakage-free SMOTE integration for more aggressive imbalance handling, and extending the benchmark with LightGBM and Isolation Forest.
- Explainability is another priority: adding SHAP-based feature attribution would make each model’s decisions more transparent and audit-ready an essential requirement in any regulated financial environment.
Conclusion
The credit card fraud detection problem is deceptively simple on the surface, binary classification, clean data, a well-known dataset , but it is one of the best illustrations in data science of how the wrong choices in evaluation and methodology can produce confidently wrong results.
This project demonstrates that doing it right does not require exotic techniques. It requires the right metric, a leakage-free pipeline, honest validation, and a willingness to look beyond accuracy. Those four principles transfer to every imbalanced classification problem you will encounter.
The full notebook and project code are publicly available if you want to explore the implementation, run the experiments yourself, or build on top of this work :
- Kaggle Notebook : View the full notebook on Kaggle
- GitHub Repository : Explore the full code and project files
Thanks for reading! If you found this article useful, feel free to leave a comment or connect. Feedback and questions are always welcome.
When Accuracy Lies: A Rigorous Machine Learning Approach to Credit Card Fraud Detection was originally published in Towards AI on Medium, where people are continuing the conversation by highlighting and responding to this story.