
Regression Analysis in Data Mining: Definition, Types and Real-World Uses
Regression analysis in data mining is a statistical technique used to comprehend the existing relationships between different variables. This data is then used to predict future outcomes. In simple terms, it helps us answer questions like “What factors influence a result?” or “What might happen next based on past trends?”
We are living in the world of data analytics and artificial intelligence where we need to analyze patterns and numbers to predict the future trends and results. This is what regression analysis in data mining is all about. It is used to support decision-making across industries such as finance, healthcare, marketing, and technology. With the help of the study of variables, regression models can make data-driven predictions with greater confidence.
Let’s break down what regression analysis really means, why it is important in data mining, and how different regression techniques are used in real-world applications.
What do you mean by Regression Analysis in Data Mining?
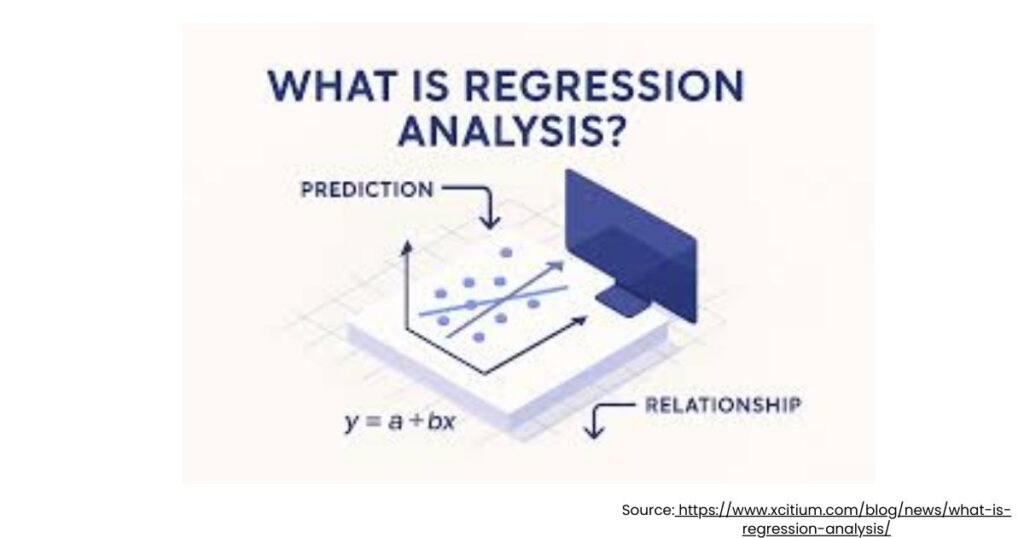
Regression analysis in data mining is the method that helps explain how different factors influence a specific outcome.
In data analysis, there are usually two main components:
- Independent variables – the factors that influence the outcome
- Dependent variable – the result we want to predict
Various regression models were designed to study the changes in independent variables and help create mathematical models to describe that relationship.
For example:
- Predicting house prices based on location and size
- Estimating sales based on advertising spending
- Forecasting demand using past purchase patterns
This is far better than the guessing game because it presents data scientists with a structured way to predict trends.
What is the Purpose of Regression Analysis?
The purpose of regression analysis goes far beyond simple predictions. It plays a major role in turning raw data into meaningful insights.
Here are some of the key purposes:
1. Understanding Relationships Between Variables
It helps in drawing the relation between different variables, their connection, and influence on each other.
2. Predicting Future Outcomes
These models are used to predict sales, revenue, demand, or customer behavior for different businesses.
3. Identifying Important Factors
It helps determine which variables actually affect the outcome and which ones do not.
4. Improving Decision-Making
Organizations rely on regression analysis to make data-backed decisions instead of relying on assumptions.
Real-World Problems Regression Analysis Is Widely Used For Solving
Today, regression analysis is widely used for solving real-world problems across industries. Some common applications include:
- Business and Marketing: Companies analyze customer data to understand how pricing, promotions, and campaigns impact sales.
- Finance: Banks use regression models to assess risks, forecast market trends, and evaluate investments.
- Healthcare: Researchers analyze patient data to predict disease risks or treatment outcomes.
- Manufacturing: Regression models help predict product demand and optimize production processes.
- Education and Research: Scientists and researchers rely on regression to analyze experimental data and test hypotheses.
In many cases, regression also helps detect patterns, evaluate assumptions, and analyze trends over time.
Different Types of Regression Analysis
There are several different types of regression analysis, each suited for different kinds of data and research problems.
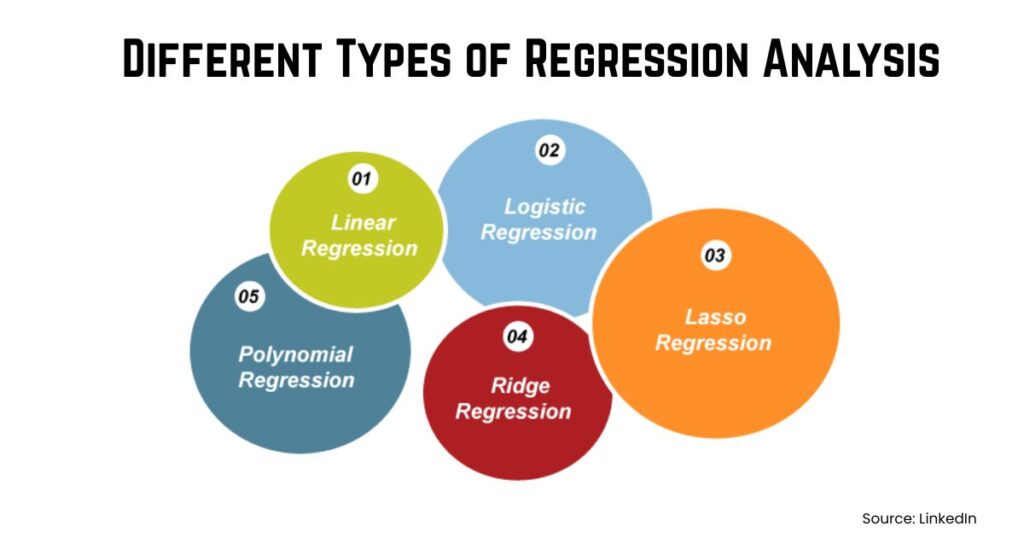
1. Linear Regression
Linear regression is the most commonly used regression model. It assumes that the relationship between the input variable and the output variable is linear, meaning it can be represented with a straight line.
The mathematical equation looks like this: Y=c+mX+e
Where:
- Y = dependent variable (the value we want to predict)
- X = independent variable (input feature)
- c = intercept
- m = slope of the line
- e = error term
In simple terms, the model tries to draw a best-fit line through the data points to predict values.
It is commonly used for:
- Sales prediction
- Salary estimation
- Market trend analysis
2. Logistic Regression
Despite its name, logistic regression is mainly used for classification problems rather than predicting continuous numbers. It predicts the probability of an event occurring, such as yes/no or true/false.
Instead of a straight line, logistic regression uses a sigmoid (S-shaped) curve.
The probability equation is:
P(Y=1)=11+e−(a+bX)P(Y=1) = frac{1}{1 + e^{-(a + bX)}}P(Y=1)=1+e−(a+bX)1
The output always lies between 0 and 1, representing probability.
Example:
A model predicting whether a transaction is fraudulent (1) or legitimate (0) based on variables like transaction amount and location. If the probability is greater than 0.5, the model classifies it as fraud.
3. Polynomial Regression
Polynomial regression is used when the relationship between variables is not linear but curved.
Instead of fitting a straight line, the model fits a polynomial equation to the data.
The equation looks like:
Y=a+b1X+b2X2+b3X3Y = a + b_1X + b_2X^2 + b_3X^3Y=a+b1X+b2X2+b3X3
This allows the regression curve to bend and capture more complex relationships.
Example:
Suppose we track product demand over time. Demand may increase rapidly at first, then slow down later. A curved polynomial line models this pattern better than a straight line.
4. Ridge Regression
Ridge regression is used when there are too many independent variables that are highly correlated with each other. This situation is called multicollinearity.
To solve this, ridge regression adds a penalty term to the regression equation so that coefficients do not become too large.
The loss function becomes:
Loss=RSS+λ∑β2Loss = RSS + lambda sum beta^2Loss=RSS+λ∑β2
Where:
- RSS = residual sum of squares
- λ (lambda) = penalty parameter
- β = regression coefficients
The penalty forces the model to keep coefficients small, which improves model stability and prediction accuracy.
5. Lasso Regression
Lasso regression is similar to ridge regression but with an important difference: it can eliminate unnecessary variables completely.
The penalty equation looks like:
Loss=RSS+λ∑∣β∣Loss = RSS + lambda sum |beta|Loss=RSS+λ∑∣β∣
Because of this penalty, some coefficients shrink to exactly zero, meaning the model automatically selects the most important features.
This is very useful when working with datasets that contain many variables but only a few important predictors.
Uses of Regression Analysis in Data Mining
The uses of regression analysis are especially important in data mining because they help extract meaningful insights from large datasets.
Some major uses include:
- Predictive Modeling: Regression models allow analysts to predict numerical outcomes such as sales, revenue, or demand.
- Trend Analysis: By analyzing historical data, regression helps identify patterns and long-term trends.
- Risk Assessment: Organizations use regression to estimate financial risks and make better strategic decisions.
- Performance Optimization: Regression analysis can identify the factors that influence performance, helping businesses improve efficiency.
- Data-Driven Strategy: Companies increasingly rely on regression models to guide marketing campaigns, pricing strategies, and operational planning.
How to Learn Regression Analysis for Data Science?
Regression is one of the first and most important skills in data science and analytics. If you want to work in this field, understanding regression concepts and tools is essential.
Many learners begin by studying:
- Statistics fundamentals
- Python or R programming
- Data visualization
- Machine learning basics
Structured training programs can make this learning journey much easier. For example, courses like the Data Science Program or Business Analytics certification offered by ZELL introduce learners to regression modeling, predictive analytics, and real-world data projects. Through practical assignments and industry case studies, students learn how regression techniques are applied in real business scenarios.
The Bottom Line
Regression analysis is a highly effective tool in data mining and statistical analysis. Understanding the correlations between variables enables analysts to identify patterns and make more informed judgments.
Regression models assist firms in transforming raw data into valuable insights, such as anticipating market trends or assessing healthcare data.
Learning regression analysis is not only beneficial, but also necessary, for anyone interested in data science, analytics, or machine learning. With the proper knowledge and hands-on experience, you can start applying data to solve real-world problems and pursue a successful career in analytics.
What do you mean by regression analysis?
Regression analysis is a statistical method used to understand relationships between variables and predict numerical outcomes based on historical data.
What is the purpose of regression analysis?
The main purpose of regression analysis is to identify relationships between variables, predict outcomes, and support data-driven decision-making.
What are the different types of regression analysis?
Common types include linear regression, multiple regression, logistic regression, polynomial regression, ridge regression, and lasso regression.
Where is regression analysis widely used?
Regression analysis is widely used in finance, healthcare, marketing, education, manufacturing, and data science for forecasting and analysis.
Why is regression important in data mining?
Regression helps data miners predict numerical values, discover patterns in large datasets, and build predictive models for decision-making.