
I Went from Building Websites to Building Data Pipelines — Here’s What Transferred (And What…

I Went from Building Websites to Building Data Pipelines — Here’s What Transferred (And What Didn’t)
A brutally honest career pivot story — the skills that crossed over perfectly, the ones that surprised me, and the ones I had to unlearn entirely before I could move forward.
The first time I wrote a SQL query, I stared at it for about forty-five seconds after it ran.
Not because it failed. Because it worked.
Forty-two rows. Clean. Exactly what I’d asked for. No browser to reload, no CSS to debug, no client to approve the colour. Just a question asked in a language the database understood, and an answer returned with zero drama.
I remember thinking: Oh. This is the same thing.
Not the same tool. Not the same syntax. Not even the same industry, really. But the same fundamental act — talking to a system in its own language and coaxing it into giving you exactly what you need.
That moment of recognition is what this article is about.
I spent two years building websites. WordPress themes, Figma prototypes, UI/UX flows, landing pages that had to convert or the client would call on a Friday afternoon. Then I pivoted — fully, deliberately — into data analytics. Power BI, SQL, Python, Microsoft Fabric, the whole stack.
And what I discovered surprised me. Not just what transferred — but how it transferred. And not just what didn’t — but why it didn’t, and what I had to actively unlearn.
This is that story. As honestly as I can tell it.
Before We Start: Why Pivot Stories Usually Lie
Most career pivot articles are secretly highlight reels.
They go: “I was doing X, I felt unfulfilled, I learned Y, everything clicked, now I’m thriving.” The arc is clean. The struggle is sanitised. The uncomfortable middle — where you genuinely don’t know if this was the right decision — gets edited out.
I want to resist that. Because the most useful thing I can tell anyone considering this pivot, or any pivot, is the unedited version.
There were weeks in my first year as a data analyst where I felt like a fraud. Where my UI/UX background felt like a liability, not an asset. Where I sat in team meetings nodding at words I didn’t fully understand, running mental searches for analogies in my design brain that came up empty.
There were also moments of such pure, unexpected competence that I had to physically resist the urge to announce: “By the way, I used to build websites and this thing you’re struggling with? I already know how to do it because of that.”
Both were real. Both belong in the story.
So — here’s what actually transferred. Here’s what absolutely did not. And here’s what I had to actively break down before I could rebuild it into something useful.
PART ONE: WHAT TRANSFERRED (And Surprised Me By How Well)
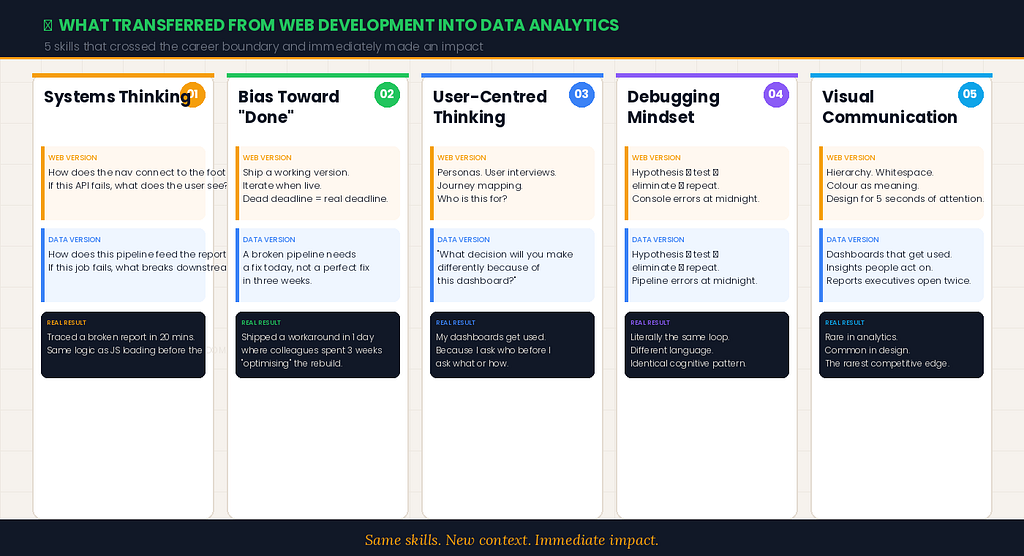
1. The Logic of Systems Thinking
The single most useful mental model I brought from web development into data analytics wasn’t a tool or a technique. It was a way of thinking.
When you build a website — a real one, not just a template — you learn to think in systems. How does the navigation connect to the footer? If I change this CSS class, what breaks? If this API call fails, what does the user see? Every element exists in a web of relationships. Change one thing and you ripple across the whole structure.
Data analytics runs on exactly the same mental model.
A data pipeline is a system. A data model is a system. A Power BI report connected to a Microsoft Fabric lakehouse is a system — with dependencies, failure points, and cascade effects that a systems thinker immediately recognises, even when the tools are new.
My first month as an analyst, I was tasked with understanding why our weekly report kept showing inconsistent numbers. My senior colleagues were baffled. I traced it in twenty minutes — not because I knew data pipelines, but because I knew how to think about dependent systems. I asked: What feeds this? What does this feed? Where could the break be?
It was a scheduling conflict between two refresh jobs — the exact same class of problem as a JavaScript function being called before the DOM loaded. Different language. Same logic.
Systems thinking transferred completely, and I didn’t even know I had it until I needed it in a new context.
2. The Discipline of “Done” Under Pressure
Web development, especially client-facing web development, teaches you something that university never could: how to finish things under imperfect conditions.
Nothing is ever ready. The client always wants one more change. The deadline is always real, the scope always drifts, and “perfect” is an enemy of “shipped.” You develop a visceral understanding of the difference between good enough for now and genuinely broken — and you learn to make that call quickly, with confidence, under pressure.
Data analytics desperately needs this skill and almost nobody talks about it.
I watched brilliant analysts spend three weeks refining a model that was needed in one week. I watched people rebuild dashboards from scratch rather than ship a working version and iterate. I watched “perfect data model” become the enemy of “insight in time to make a decision.”
The website builder in me had no patience for this. When I inherited my first broken pipeline — SSIS jobs failing at 2 AM, data missing from the morning reports — I shipped a functional workaround in a day. Not perfect. Working. We iterated.
That bias toward done over perfect, toward shipping and fixing rather than waiting for ideal, transferred completely from web development to data analytics and made me faster than colleagues with deeper technical skills.
3. Knowing Your Audience Before You Build Anything
In UI/UX, you don’t start designing until you understand who you’re designing for. User personas. User interviews. Journey maps. The whole discipline is built on the foundation that you cannot make good decisions about a product without deeply understanding the person who will use it.
I carried this habit into analytics without even consciously choosing to.
Every time I’m asked to build a dashboard or a report, my first question is still the same one I asked in web development: Who is this for, and what are they trying to do?
This drives my analytics colleagues quietly crazy, I think. They want to start modelling. I want to have a conversation first.
But the results justify it. The dashboards I build get used. Not because of the DAX, not because of the data model — because I spent thirty minutes understanding the decision my stakeholder needs to make before I wrote a single line of SQL.
User-centred thinking transferred completely. In fact, I’d argue it’s rarer and more valuable in analytics than in design, because most analysts never learn it at all.
4. Debugging as a Mindset, Not a Skill
Every web developer knows the debugging loop: something’s broken, you don’t know why, you form a hypothesis, you test it, you eliminate possibilities, you find the root cause, you fix it, you test again.
This is not a technical skill. It is a cognitive discipline. And it transfers perfectly into data work.
When a SQL query returns unexpected results, when a pipeline fails with an error that doesn’t match anything in the logs, when a Power BI visual suddenly shows the wrong numbers after a model change — the process is identical. Form a hypothesis. Isolate variables. Test. Eliminate. Repeat.
What surprised me was how many data analysts I met who didn’t have this as a natural reflex. They’d hit an error and escalate immediately, or post in Slack asking if anyone had seen this before, or just restart the job and hope.
The debugging mindset — the one built by years of unexplained console errors and CSS specificity wars and JavaScript race conditions — transferred directly and immediately, and it made me significantly more self-sufficient than I’d expected to be at that stage.
5. Visual Communication as a Native Language
I’ve written about this at length in other articles, so I’ll keep it brief here: two years of thinking visually for a living gave me an instinct for visual communication that most data analysts have to consciously learn, if they learn it at all.
Hierarchy. Whitespace. Colour as meaning, not decoration. The difference between a chart that shows data and a chart that communicates an insight.
These transferred so naturally that I sometimes forget I had to learn them at all. They feel like a first language now. But they’re not — they’re a second language I learned in web design and speak fluently in data, and that fluency is worth more than I can quantify.
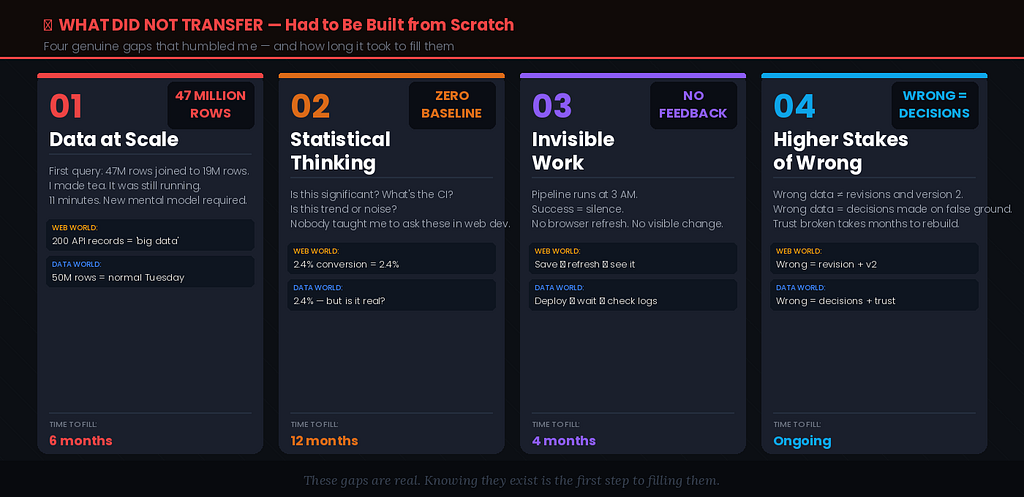
PART TWO: WHAT DID NOT TRANSFER (And Humbled Me)
1. The Scale of Data Was Genuinely Shocking
In web development, you think about data in human-sized chunks. A contact form submission. A user’s shopping cart. An API response with maybe two hundred records.
My first week as a data analyst, I was handed a table with 47 million rows and asked to join it to another table with 19 million rows.
I wrote the query. I ran it. I waited. I waited more. I got up and made tea. I came back. Still running.
Eleven minutes later, the query returned. And I had fundamentally understood something that no amount of reading could have taught me: data at scale is a different problem than data at human scale. The cognitive models don’t just scale up — they break and have to be rebuilt.
Indexing, query optimisation, cardinality, partitioning — these weren’t just new vocabulary. They were concepts for a reality I’d never had to reason about before. A WHERE clause that’s perfectly fine on ten thousand rows can be catastrophic on fifty million. A data model that’s elegant for a prototype can be unusable in production at scale.
I spent six months rebuilding my intuitions about what “efficient” means when the numbers have seven digits. It was humbling, necessary, and nothing from web development prepared me for it.
2. Statistical Thinking Has No Web Development Equivalent
Nobody told me that becoming a data analyst would require me to think statistically, and I wish someone had.
In web development, a conversion rate is a conversion rate. 2.4% is 2.4%. You optimise it, you track it, you report it. The number is the number.
In data analytics, the number is never just the number. Is it statistically significant? What’s the confidence interval? Is this a real trend or noise? Is this correlation or coincidence?
I had none of this. Zero. Web development doesn’t build statistical intuition — it builds design intuition, systems intuition, user intuition. Statistics requires an entirely different cognitive foundation.
I took an online statistics course. I read books. I built small projects specifically to develop the muscle. It took the better part of a year before I stopped second-guessing myself when interpreting analytical results, and honestly, I’m still building the confidence.
This did not transfer. It had to be built from scratch.
3. Patience With Invisible Work
Web development produces visible output. You write code, you save, you refresh the browser. Something changed. You can see it. You can show it. The feedback loop is tight and satisfying.
Data engineering is full of invisible work.
A pipeline runs at 3 AM and you’ll know if it worked when you check the logs in the morning. A data model change gets deployed and won’t be validated until the next business cycle runs through it. A schema optimisation might improve query performance by thirty percent, and your stakeholder will never know it happened because the experience just gets slightly faster.
I found this maddening at first. I was used to shipping something and watching it change. In data engineering, you’re often shipping something and watching nothing — and that’s correct, because the absence of errors is the success state.
I had to consciously retrain my relationship with feedback loops. Learn to find satisfaction in clean logs. Learn to feel pride in systems that run without drama rather than features that look impressive. Learn to celebrate the 3 AM pipeline that doesn’t wake me up.
It took longer than I expected. And it still requires active mental effort sometimes.
4. The Culture Around “Wrong”
In web development, especially client work, you cultivate a certain relationship with being wrong. Clients change their minds. Requirements shift. What was right last week is wrong this week, and it’s nobody’s fault — it’s just the nature of a creative and iterative process. “Wrong” is usually temporary and fixable.
In data analytics, wrong is a different weight.
If I show an incorrect number to an executive, it doesn’t just mean a revision and a new version. It means their trust in the entire analytical function erodes. It means decisions were potentially made on false foundations. It means a conversation I don’t want to have, about data I was responsible for, that was wrong.
The stakes of “wrong” in data analytics are higher, more consequential, and longer-lasting than in web work. I had to develop a different quality mindset — more rigorous validation, more defensive building, more documentation, more “but have I checked this one more time?” before I ship.
This wasn’t a technical transfer problem. It was a psychological one. The standard of correctness is different, and my defaults had to change.
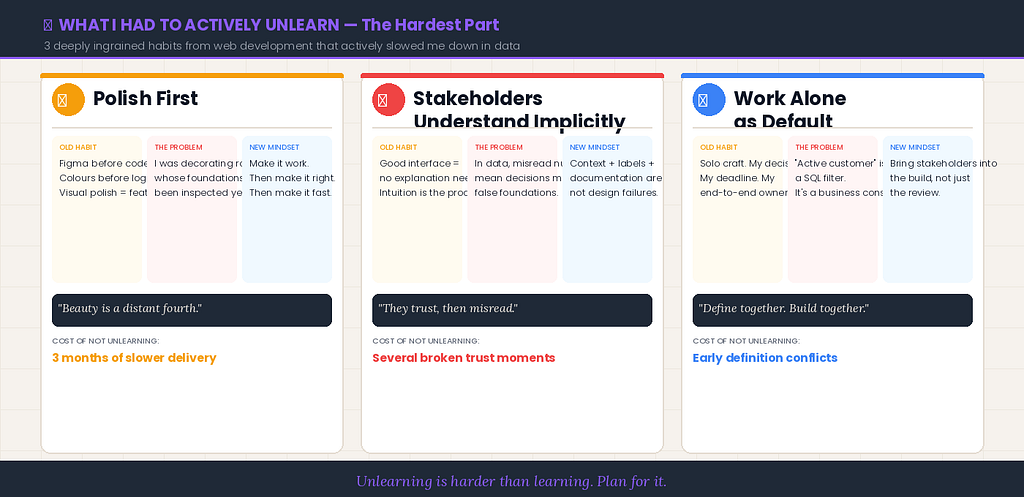
PART THREE: WHAT I HAD TO ACTIVELY UNLEARN
1. The Instinct to Make Things Pretty First
Web development trained me to care about how things look from the very first moment. Sketches in Figma before a line of code. Colour palette decided before functionality is built. Visual polish as a feature, not an afterthought.
In data work — particularly in data engineering and pipeline work — this instinct is actively counterproductive.
I spent the first three months beautifying things that didn’t need to be beautiful. I formatted SQL queries with elaborate spacing and colour-coded comments before I’d confirmed the logic was correct. I built Power BI reports with perfect alignment and consistent fonts before I’d validated the underlying data model.
I was decorating rooms whose foundations hadn’t been inspected yet.
My senior analyst colleague said it best: “Make it work, then make it right, then make it fast. Beauty is a distant fourth.”
In web development, the hierarchy is almost reversed. I had to consciously, repeatedly, frustratingly override my instinct to polish early. I still catch myself doing it sometimes. I still have to stop and ask: does the logic work first?
2. The Assumption That Stakeholders Know What They’re Looking At
In web development, the interface is the product. You test it with users. You watch their faces. You iterate until they don’t have to think. The assumption is that the person using what you’ve built will interact with it visually and intuitively, without needing to understand what’s behind it.
In data analytics, I brought this assumption with me and it caused real problems.
I built dashboards and assumed stakeholders would intuit the logic — that they’d understand what “YTD attainment” meant without a definition, that they’d know a line chart was showing rolling averages rather than actuals, that they’d recognise a filter was applied to the view.
They didn’t. They trusted the numbers without understanding the numbers. And that’s dangerous — because a stakeholder who doesn’t understand what they’re looking at will eventually make a decision based on a misread, and it will be my data they misread.
I had to unlearn the design assumption that intuitive interfaces remove the need for explanation. In data analytics, some level of explanation is always required — not because the interface failed, but because the stakes of misunderstanding are different.
Context, documentation, and clear labelling aren’t design failures to compensate for. They’re features.
3. Working Alone as the Default Mode
Web development, especially freelance or small-agency work, is often a solo craft. You’re responsible for your work end to end. The decision-making is yours. The debugging is yours. The deployment is yours.
Data analytics at even a moderate scale is inherently collaborative — and not just collaboratively building, but collaboratively defining what “correct” even means.
I had to unlearn the solo artist mentality. Learn to bring stakeholders into the building process, not just the reviewing process. Learn to write code that other people would maintain, not just code that I understood. Learn that data definitions require organizational consensus, not just technical correctness.
“What does ‘active customer’ mean?” is not a data question in analytics. It’s a business question, a legal question, a departmental politics question. And it requires conversation and documentation, not just a clever SQL filter.
I was used to making those calls alone. I had to learn to make them together.
The Honest Summary
Two years of web development gave me more for data analytics than I knew I had. And it left more gaps than I’d expected.
Here’s the honest ledger:

Transferred immediately: Systems thinking. Bias toward done. User-centred design instincts. Debugging as a mindset. Visual communication fluency.
Did not transfer — had to build from scratch: Statistical thinking. Intuitions about data at scale. Patience with invisible work. The higher stakes of “wrong.”
Had to actively unlearn: Polish-first instinct. Assuming stakeholders understand what they’re looking at. Working alone as the default.
If you’re a web developer considering a pivot into data analytics, here’s my actual advice, not the sanitised version:
Your background is a genuine advantage. The systems thinking, the user empathy, the debugging mindset, the visual communication — these are rare in the data world and they will set you apart.
But go in knowing what you’ll need to build. Statistical thinking is not optional and it is not quick. Data at scale will break your mental models and you’ll need patience while you rebuild them. The invisible work will feel unrewarding until you retrain yourself to find the reward in silence.
And plan to unlearn the polish-first habit. It will follow you across the pivot and it will slow you down until you catch it.
None of this means the pivot isn’t worth it. For me, it was the best professional decision I’ve made.
But the pivot articles that skip the hard parts do a disservice to everyone who’s standing at the edge of one, deciding whether to jump.
So: jump, if it’s what you want. Eyes open. Expecting the transfer, the gaps, and the unlearning all at once.
It’s worth it. Even the hard parts.
I’m Sheth Priyanka — data analyst, ex-UI/UX developer, Microsoft Fabric practitioner, and recovering perfectionist. I write about the messy, human reality of working with data. Follow me on Medium for more stories like this one.
I Went from Building Websites to Building Data Pipelines — Here’s What Transferred (And What… was originally published in Towards AI on Medium, where people are continuing the conversation by highlighting and responding to this story.