go-size-analyzer

go-size-analyzer

The Go ecosystem is really good at tooling. I just learned about this tool for analyzing the size of Go binaries using a pleasing treemap view of their bundled dependencies.

You can install and run the tool locally, but it’s also compiled to WebAssembly and hosted at gsa.zxilly.dev – which means you can open compiled Go binaries and analyze them directly in your browser.

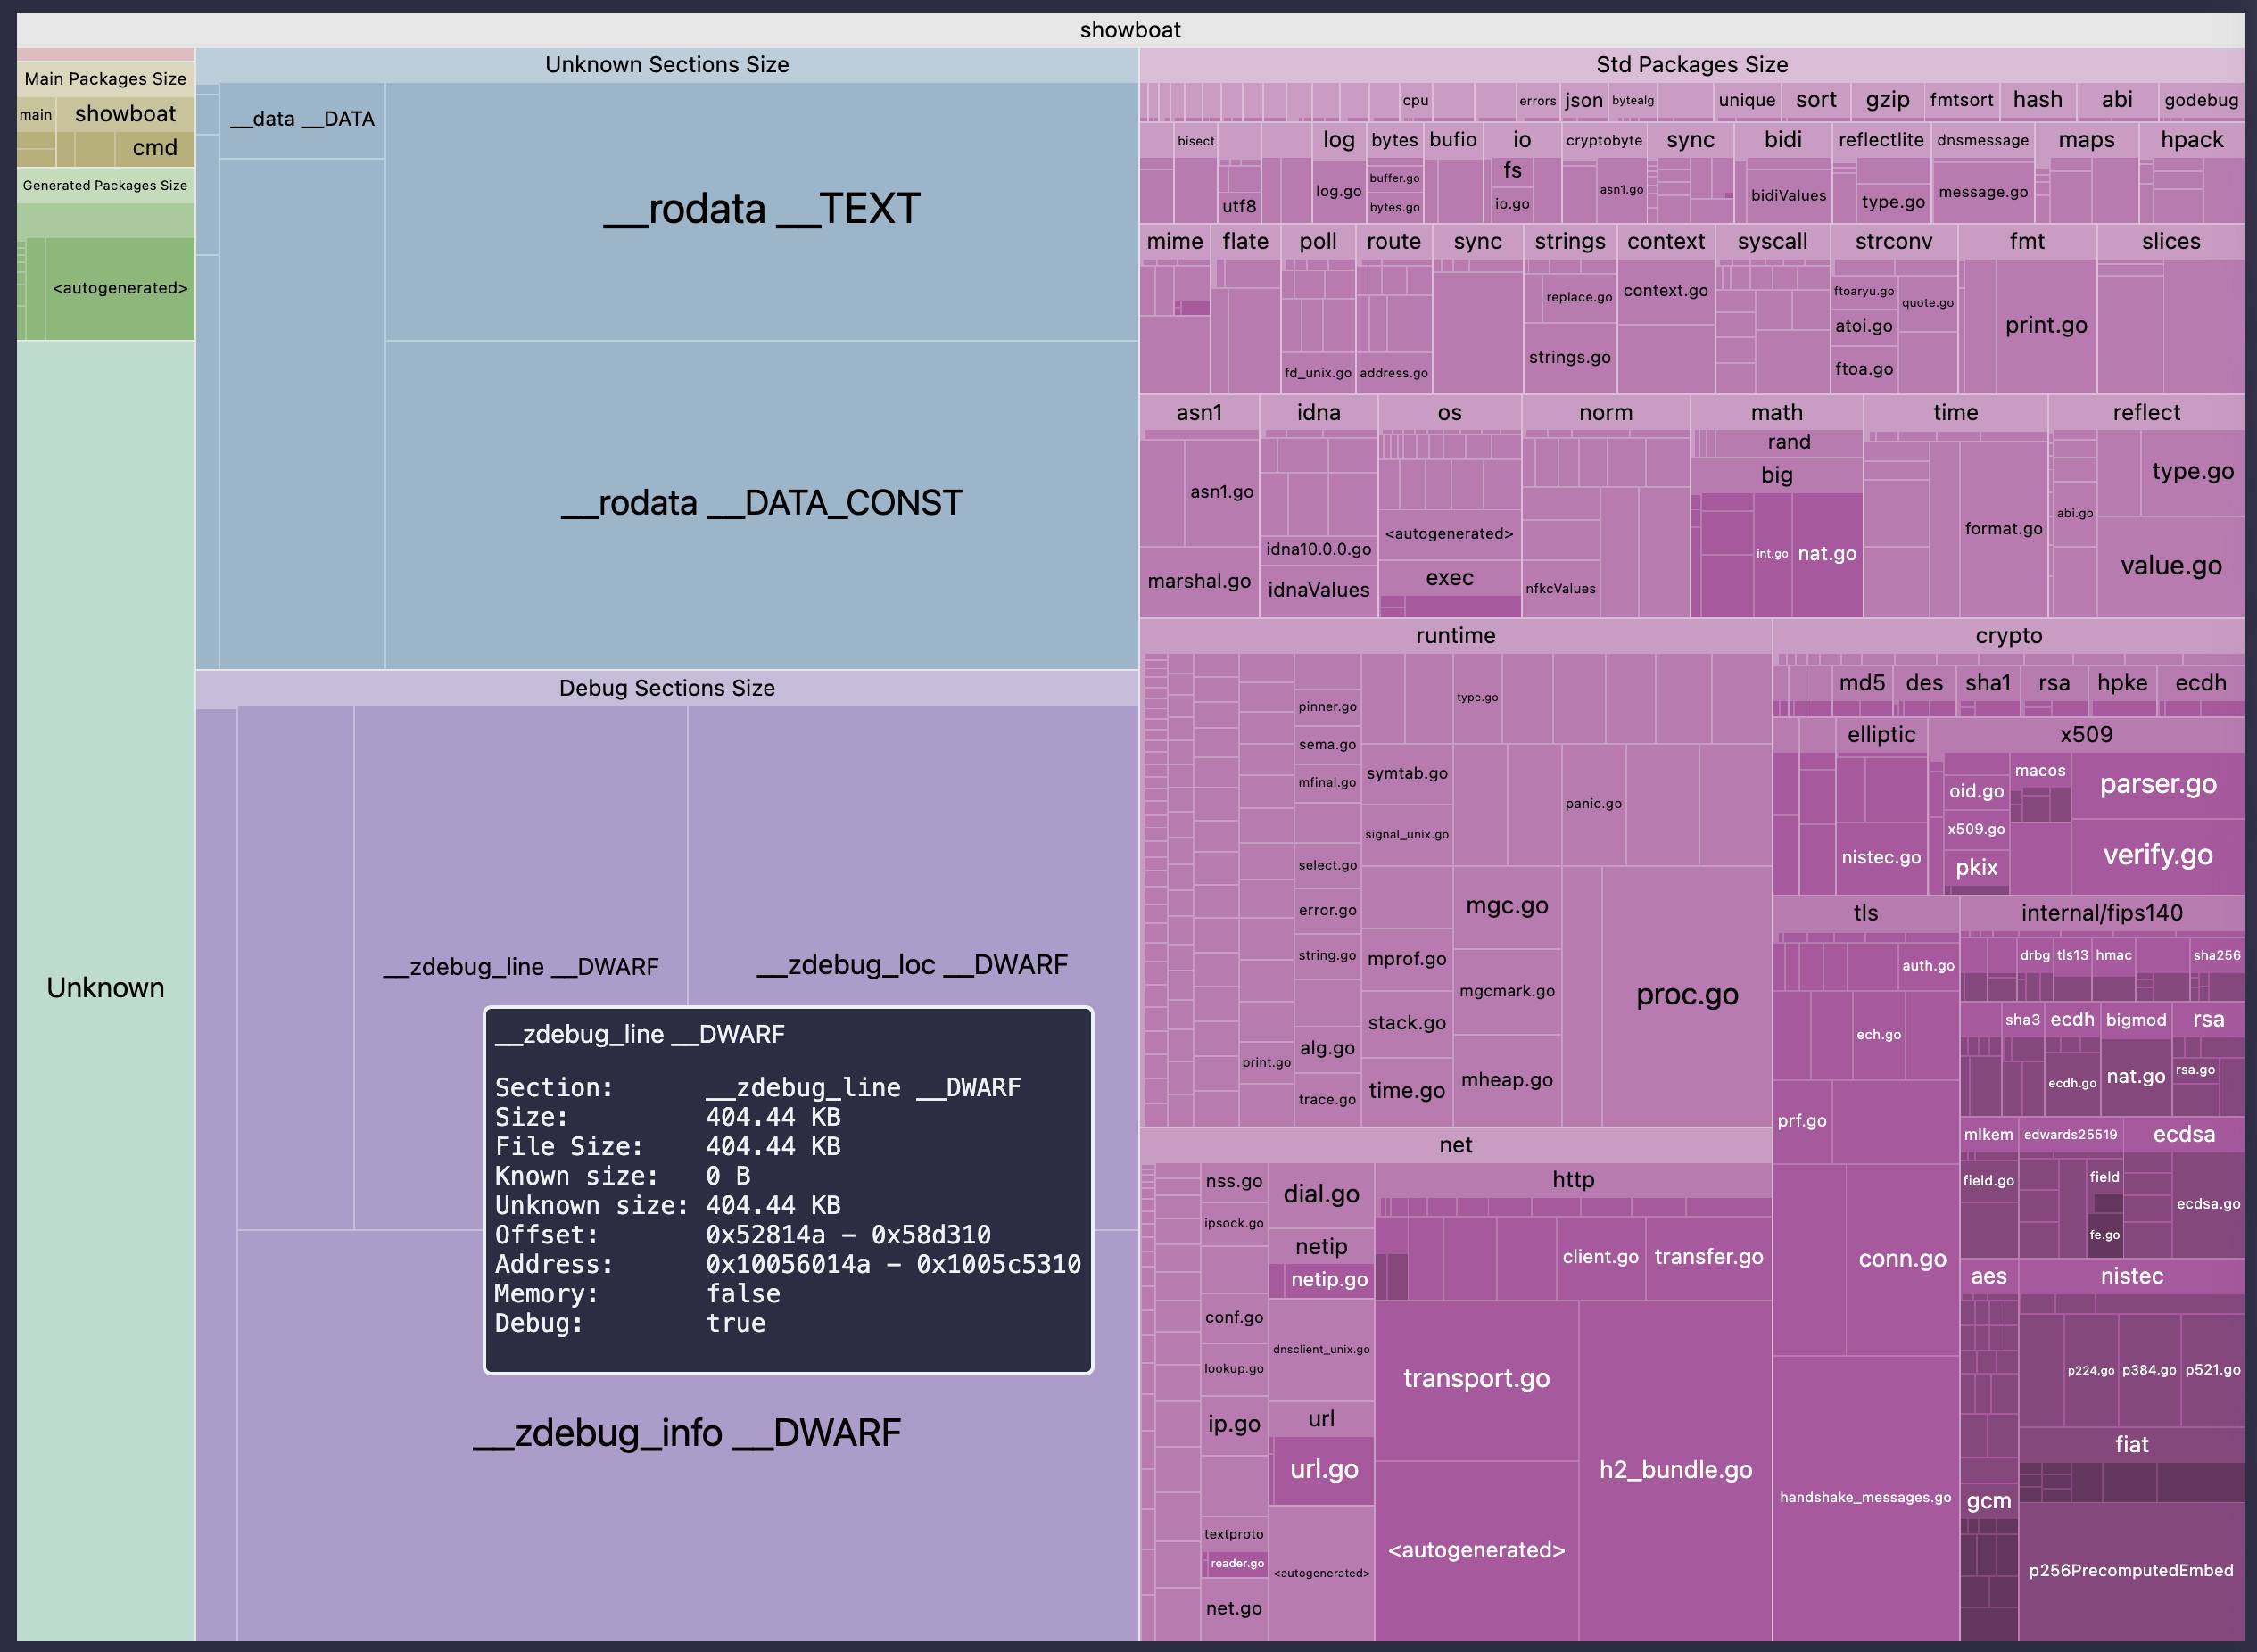
I tried it with a 8.1MB macOS compiled copy of my Go Showboat tool and got this:

Treemap visualization of a Go binary named "showboat" showing size breakdown across four major categories: "Unknown Sections Size" (containing __rodata __TEXT, __rodata __DATA_CONST, __data __DATA, and Debug Sections Size with __zdebug_line __DWARF, __zdebug_loc __DWARF, __zdebug_info __DWARF), "Std Packages Size" (showing standard library packages like runtime, net, crypto, reflect, math, os, fmt, strings, syscall, context, and many subpackages such as crypto/tls, crypto/x509, net/http, with individual .go files visible at deeper levels), "Main Packages Size" (showing main, showboat, cmd), and "Generated Packages Size" (showing <autogenerated>). A tooltip is visible over __zdebug_line __DWARF showing: Section: __zdebug_line __DWARF, Size: 404.44 KB, File Size: 404.44 KB, Known size: 0 B, Unknown size: 404.44 KB, Offset: 0x52814a – 0x58d310, Address: 0x1005c014a – 0x1005c5310, Memory: false, Debug: true. The treemap uses green for main/generated packages, blue-gray for unknown sections, and shades of purple/pink for standard library packages.

Via Datadog: How we reduced the size of our Agent Go binaries by up to 77%

Tags: go, webassembly, showboat

Liked Liked