
Day 1 to Production: Observability for AI-Powered Applications
How to instrument your AI application on day 1 and scale it as your product grows and why you can’t afford to skip it.

When you’re starting an LLM powered project, observability is the last thing on your mind. You’re excited. The thing works. Adding instrumentation feels like busywork and why slow down to log things when everything is clearly fine?
I’ve been there. And then one day you hit an unexpected or wrong response, dig into your logs, and find nothing useful. The request succeeded with HTTP 200, latency fine, no errors. But you have no idea what prompt was sent, what context was included, or what the model actually returned. You’re debugging blind.
That’s the moment observability stops feeling like busywork.
Standard tools, the ones you’d use for a REST API, aren’t equipped for this. They’ll tell you the request succeeded. They won’t tell you why the model ignored the system prompt, why the agent called the wrong tool three times in a row, or why responses for the same input vary wildly.
This post is the guide I wish I had from day one: a practical map of what LLM observability looks like as your project grows, from a single API call all the way to a full-scale production system.
First, Let’s Get the Vocabulary Straight
Before diving into tooling, you need four terms to be crystal clear in your head. They’re used loosely in the wild, but they mean specific things.
Log → A discrete event with a timestamp. Unstructured or semi-structured. “User submitted query at 14:32:01.” Logs are cheap to emit, easy to search, and terrible for understanding causality across multiple services.
Metric → A numeric measurement aggregated over time. Request count, p99 latency, token spend per hour. Great for dashboards and alerting. Terrible for debugging a specific failing request.
Trace → A complete record of a single request as it flows through your system. A trace is made of spans. Think of a trace as the story of one user interaction, told as a timeline.
Span → One unit of work within a trace. An LLM call is a span. A database lookup is a span. A tool invocation is a span. Spans can be nested with a parent span representing the full agent loop can contain child spans for each LLM call and tool call within it.
Here’s what that looks like for a simple research agent that synthesizes information found via web search tool:
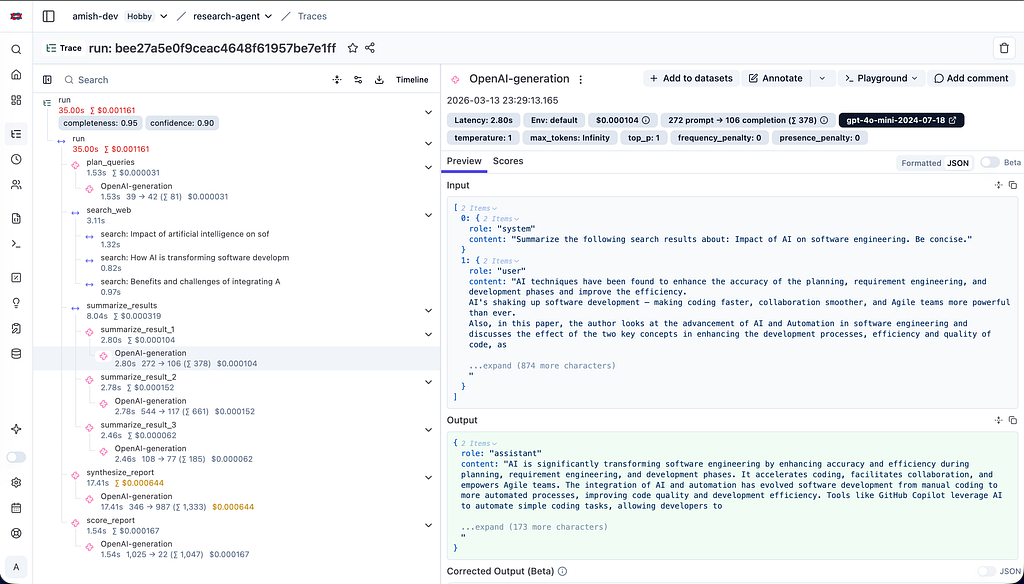
This is the unit of visibility that LLM observability is built around. Not individual logs. Not aggregated metrics. The full causal story of a single request.
Why Standard APM Tools Aren’t Enough
You might already use something like Datadog or Grafana for your backend. These tools are excellent at what they were designed for tracking latency, error rates, throughput, infrastructure health.
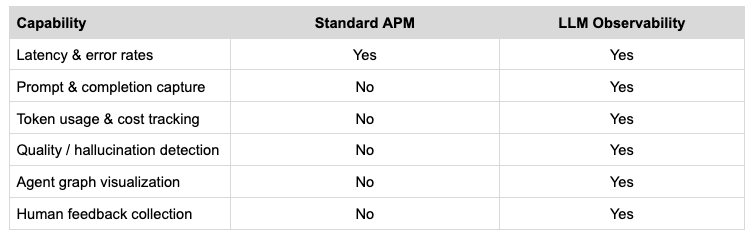
But they fall short for LLM applications in three specific ways:
» They can’t capture LLM-specific semantics. An APM tool will record that your /chat endpoint took 2.3 seconds. It won’t capture the prompt, the model version, the temperature setting, the number of tokens, or the completion. You need all of those to debug why a response was bad.
» They can’t model quality. A 200 OK with a hallucinated answer looks identical to a 200 OK with a correct one at the HTTP layer. Quality is a semantic concept, not a systems concept. Standard APM has no model for it.
» They can’t represent agent graphs. A modern agentic application isn’t a linear request-response. It’s a graph — an agent calls a tool, the tool result goes back to the agent, the agent decides to call another tool or hand off to a sub-agent, and so on. Standard distributed tracing was designed for microservices that call each other in a largely linear chain. Representing cyclical agent loops, parallel tool invocations, and multi-agent handoffs requires richer data models.
LLM-specific observability tools like Langfuse, LangSmith, etc are built from the ground up with these problems in mind. They capture prompts and completions natively. They have models for quality scores and human feedback. They can visualize agent graphs.
A Quick Word on OpenTelemetry
OpenTelemetry (OTel) is an open standard maintained by the CNCF. The core idea: instrument your code once, and route signals to any compatible backend like Jaeger, Datadog, Langfuse by changing config, not code.
Instrumenting your code simply means adding the lines that emit observability data telling the SDK “this is where a span starts, this is where it ends, here’s the metadata I want attached.” It’s the act of making your code observable rather than silent.

For most LLM projects you won’t need to touch OTel directly as tools like Langfuse provide higher-level SDKs that are much easier to get started with. But it’s good to know it’s there, because it means your instrumentation is never locked to a single vendor.
The Tooling Landscape
A quick orientation before going deep on Langfuse:
LangSmith → Built by the LangChain team. Tightly integrated with LangChain and LangGraph. If your entire stack is LangChain, LangSmith is almost zero-effort to wire up as you literally set two environment variables. Closed source, subscription-based.
Langfuse → Open source, self-hostable, and framework-agnostic. Works with any SDK, such as OpenAI, Anthropic, Cohere, or even raw HTTP calls. Has a generous free tier on the cloud-hosted version. This is the tool we’ll use for all examples in this post.
Arize Phoenix →Strong focus on evaluation and monitoring at scale. Popular in enterprise settings. Good for teams that need advanced online eval pipelines.
The general rule: if you’re using LangChain/LangGraph, use LangSmith. If you’re building with raw SDKs or want to stay open source, use Langfuse.
A note on this post: All code examples from here on use Langfuse simply because it is open source, provider-agnostic, and free to get started with. The concepts translate directly to LangSmith or any other tool in this space.
The Progression: Stage 1 to Full Scale
Let’s now walk through what observability actually looks like as your project evolves. This is the heart of this post.
Stage 1: You Have One LLM Call. Wire Up the Basics.
You’ve just built your first feature. It takes a user message, sends it to an LLM API, and returns a response. Simple.
At this stage, most developers add a print(response) statement and call it observability. Don’t.
Day 1 is exactly when you should wire up Langfuse because the cost is near-zero, and the habit pays forward dramatically.
The minimal integration: drop-in for OpenAI:
# swap this single import
from langfuse.openai import openai

# Everything else stays exactly the same
response = openai.chat.completions.create(model="gpt-5.4", messages=[...])
That’s it. By swapping from openai import openai for from langfuse.openai import openai, every call is automatically traced – model, prompt, completion, token counts, latency, cost.
What you get on Day 1:
» A trace for every LLM call, automatically
» Token usage and estimated cost per call
» Latency breakdown
» Full prompt and completion stored and searchable
This takes about 10 minutes. You now have a searchable history of every LLM call your application has ever made. When something goes wrong, you can look it up in the Langfuse dashboard rather than digging through server logs.
The one habit that matters most at this stage: thread a user_id and session_id through every call.
@app.post("/chat")
async def chat(request: ChatRequest, current_user: User = Depends(get_current_user)):
    trace = langfuse.trace(
        name="chat-response",
        user_id=current_user.id,        # from auth token
        session_id=request.session_id,  # from request payload
    )
    # rest of your logic
A user_id attached from day one means you can later filter all traces for a specific user to debug their experience. A session_id means you can reconstruct the full arc of a multi-turn conversation.
Stage 2: You Have Multiple Calls. Now You Need Traces, Not Just Logs.
Your application has grown. What started as one LLM call is now a small pipeline: classify the user’s intent, retrieve some documents, pass them to the LLM, post-process the output. Maybe you’ve added a tool or two.
Individual call logs are no longer enough. You need to see the whole pipeline as a single unit : what happened, in what order, how long each step took, where things went wrong.
This is where Langfuse’s tracing model becomes essential. You create a parent trace for each user interaction, and nest spans inside it for each step.
@app.post("/chat")
async def chat(request: ChatRequest, current_user: User = Depends(get_current_user)):
    trace = langfuse.trace(name="answer-user-query", user_id=current_user.id, session_id=request.session_id, input=request.query)

    # 1. classify
    classify_span = trace.span(name="classify-intent")
    intent = classify_intent(request.query)
    classify_span.end(output={"intent": intent})

    # 2. RAG
    retrieval_span = trace.span(name="retrieve-documents")
    docs = retrieve_documents(request.query, intent)
    retrieval_span.end(output={"num_docs": len(docs)})

    # 3. Process
    generation = trace.generation(name="generate-answer", model="gpt-5.4", input=[...])
    response = openai.chat.completions.create(model="gpt-5.4", messages=[...])
    generation.end(output=response.choices[0].message.content)
    trace.update(output=response.choices[0].message.content)
In the Langfuse UI, you can now click on any trace, see the exact prompt that was sent to the model, the context that was retrieved, and the response that came back. When a user complains “it gave me a wrong answer,” you can pull up their trace in 10 seconds and see exactly what the model was working with.
Also add this at Stage 2: structured logging with trace IDs.
Your existing application logs should include the Langfuse trace ID so you can correlate between your logs and the Langfuse dashboard.
@app.post("/chat")
async def chat(request: ChatRequest, current_user: User = Depends(get_current_user)):
    trace = langfuse.trace(name="answer-user-query", user_id=current_user.id, session_id=request.session_id, input=request.query)
    # Log the trace ID alongside your regular log lines
    # Now you can jump directly from a log entry to the exact Langfuse trace
    log.info("handling_user_query",
             user_id=current_user.id,
             session_id=request.session_id,
             langfuse_trace_id=trace.id,
             query_length=len(request.query))
    ...
Stage 3: You Have an Agent. Now You Need Agent-Aware Tracing.
Your application has crossed a threshold. There’s now a loop. An orchestrator LLM decides what to do next, calls a tool, gets the result, decides again, maybe calls another tool, eventually produces an answer. You might have multiple specialized agents that hand off to each other.
At this stage, observability becomes genuinely hard. The trace is no longer a linear sequence of steps as it’s a graph. Tools are called in parallel. Agents invoke sub-agents. The number of LLM calls in a single user interaction is variable and sometimes large.
Langfuse’s nested span model handles this well. The key insight: every agent invocation, every tool call, every LLM call is a span. They’re all nested under the appropriate parent.
@app.post("/research")
async def research(request: ResearchRequest, current_user: User = Depends(get_current_user)):
    trace = langfuse.trace(name="research-agent", user_id=current_user.id, session_id=request.session_id, input=request.query, tags=["agent", "research"])
    while iteration < max_iterations:
        # Each iteration of the agent loop is its own span
        iteration_span = trace.span(name=f"agent-iteration-{iteration}")

        generation = iteration_span.generation(name="decide-next-action", model="gpt-5.4", input=messages)
        response = openai.chat.completions.create(model="gpt-5.4", messages=messages, tools=RESEARCH_TOOLS)
        generation.end(output=response.choices[0].message.content or "[tool call]")

        if response.choices[0].finish_reason == "stop":
            trace.update(output=response.choices[0].message.content)
            return response.choices[0].message.content

        for tool_call in response.choices[0].message.tool_calls:
            # Each tool call gets its own span, nested under the iteration
            tool_span = iteration_span.span(name=f"tool-{tool_call.function.name}", input=tool_args)
            tool_result = execute_tool(tool_call.function.name, tool_args)
            tool_span.end(output=tool_result)
            # ... append result to messages
        iteration_span.end()
What this gives you:
In the Langfuse dashboard, you now see a fully expanded waterfall for the agent run. You can see every iteration, every tool call within each iteration, what inputs each tool received, what it returned, and how the model used those results in the next iteration.
This is the level of visibility that makes the difference between “my agent sometimes fails” and “my agent fails when the search tool returns more than 3 results and the context gets too long.”
Full Scale: Your Product is Live. Now You Need Evaluation.
Your application is in production. You have real users. You’re iterating on prompts regularly. You’re adding new features. You need to know systematically whether your changes are making things better or worse.
At this stage, observability expands to include three new capabilities:
» Online evaluation
» User feedback collection
» Prompt version management.
Online Evaluation with Langfuse Scores
An eval in the LLM context means attaching a quality score to a trace or generation. This score might come from a human reviewer, from automated rule-based checks, or from an LLM-as-judge i.e a second model call that evaluates the quality of the first model’s response.
Langfuse makes it easy to attach scores to any trace or generation:
def evaluate_response(trace_id: str, question: str, answer: str):
    # LLM-as-judge: ask a cheaper model to score the response
    result = call_llm_judge(question, answer)  # returns {"score": 1-5, "reason": "..."}

    langfuse.score(
        trace_id=trace_id,
        name="response-quality",
        value=result["score"],
        comment=result["reason"],
    )
Once you’re recording scores, Langfuse aggregates them over time. You can now see: “Our average quality score this week is 3.8, down from 4.1 last week. Let me look at which traces pulled it down.”
User Feedback
The most valuable signal of all is direct user feedback. If your product has any kind of thumbs up/thumbs down, star rating, or correction mechanism, wire those signals into Langfuse:
def record_user_feedback(trace_id: str, rating: int, comment: str = None):
    langfuse.score(trace_id=trace_id, name="user-feedback", value=rating, comment=comment)
Now you have a feedback loop: user gives a bad rating → you look at the trace → you see what went wrong → you fix the prompt → you deploy → the score improves.
Prompt Versioning
At scale, you’ll be iterating on your prompts frequently. Without version tracking, you can’t answer “did this prompt change cause quality to drop?” Langfuse has a built-in prompt management system:
prompt = langfuse.get_prompt("research-agent-system-prompt", version=3)
system_prompt_text = prompt.compile()

response = openai.chat.completions.create(
    model="gpt-5.4",
    messages=[{"role": "system", "content": system_prompt_text}, ...]
)
When you create a trace generation and link it to the prompt version, Langfuse can show you quality scores broken down by prompt version. “Version 4 has a 12% higher quality score than version 3” is now a thing you can say with data.
A Better Way to Write This Code: Decorators
If you’ve read through the code examples in this post, you may have noticed a pattern: every function manually creates spans, calls .end(), builds the hierarchy explicitly. It works – and that verbosity was intentional. Seeing the raw API makes it clear exactly what a trace is, what a span is, and how they nest.
But this is not how you’d write it in a real codebase.
What is a decorator?
In Python, a decorator is a function that wraps another function to add behaviour without modifying its body. The @something syntax you see above function definitions – that’s a decorator. Langfuse ships a @observe decorator that handles the entire span lifecycle for you:
from langfuse import observe
@observe()
def classify_intent(query: str) -> str:
    return call_llm(query)  # pure business logic - no tracing code anywhere
That single @observe line automatically starts a span when the function is called, captures its inputs and return value, records latency, handles exceptions, and closes the span. Nothing inside the function changes.
When functions decorated with @observe call each other, Langfuse automatically infers the parent-child relationship and builds the correct nested trace structure – no manual hierarchy wiring required.
The trace hierarchy is identical to what we built manually. The business logic reads like business logic. The observability layer sits around the code, not inside it.
A Brief Note on Evals
Evals appeared in this post as online evaluation for attaching quality scores to live production traces. That’s just the surface of a much broader discipline that covers offline test datasets, pre-deploy regression suites, and human evaluation pipelines.
The key thing for now: evals are the bridge between observability (knowing what happened) and improvement (making things better). The traces and scores you’re already collecting are the raw material. We’ll go deep on the eval layer in a future post.
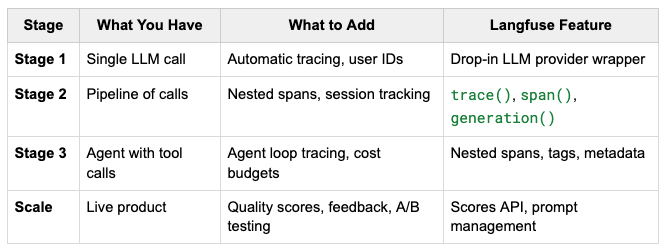
The Day 1 → Scale Roadmap at a Glance
The One Rule Above All Others
Everything in this post can be added incrementally. You don’t need the full stack on day one. You can layer it in as complexity demands it.
But one thing cannot be added retroactively: a trace_id and user_id threaded through your logs from day one.
If you take nothing else from this post, take this: spend 30 minutes on day one wiring up Langfuse and attaching a user ID and session ID to every call. Every other piece of observability infrastructure described here like the agent tracing, quality scores, etc is easier to add later. Correlating user complaints to specific requests when you have no user context in your traces is not.
Start small. Be consistent. Your future self debugging a production incident at 2 am will be grateful.
Day 1 to Production: Observability for AI-Powered Applications was originally published in Towards AI on Medium, where people are continuing the conversation by highlighting and responding to this story.