
Customer Segmentation and Retention Strategy using Transactional Data
Today, I want to walk you through my project — Customer Segmentation & Retention Strategy using Transactional Data.
So what is it?
You will be definelty heard of the term Churn Prediction.

Churn prediction uses data analysis and machine learning to identify customers likely to stop using a product or service, allowing businesses to proactively retain them by spotting early warning signs.
In other terms, we can define customer churn as the number of existing customers lost, for any reason at all, over a given period of time. It provides companies with an understanding of customer satisfaction and customer loyalty, and can identify potential changes in a company’s bottom line.
Why is it important?
Churn prediction is critical because it allows businesses to proactively identify at-risk customers, enabling targeted retention strategies that are far more cost-effective than acquiring new ones.
What are we analysing in this project?
In this projects analysis is structured as follows.
- Data Understanding & Quality — Can the business rely on this data?
- Customer Activity Over Time — Understand overall customer engagement.
- Purchase Behavior Analysis — Understand frequency & value patterns.
- Monetary Value Distribution — Identify value concentration.
- Recency & Inactivity Patterns — Understand inactivity before modelling churn.
- RFM Segmentation — Segment customers by transactional value.
- Behavioural Stability (RSS) — Identify unstable vs predictable customers.
- Churn Label Validation — Validate churn definition.
- Segment × Churn × Value Analysis — Tie everything together.
- Business Recommendations — Convert analysis into strategy.
Problem Statement
The Online Retail Store wants to reduce customer churn and increase lifetime value by targeting the right customers with the right interventions. In order to setup customer churn prediction model, they needto analyse the sales data, and with that analysis, they can set up an churn prediction model which suilts there business needs.
Dataset
This is the Online Retail dataset, provided by the UCI, which contains transactions (including cancellations) carried out by an online retailer (mainly focused on gift items) between 01/12/2009 and 09/12/2011.
- Invoice: Invoice number. A 6-digit integral number uniquely assigned to each transaction. If this code starts with the letter ‘c’, it indicates a cancellation.
- StockCode: Product (item) code. A 5-digit integral number uniquely assigned to each distinct product.
- Description: Product (item) name.
- Quantity: The quantities of each product (item) per transaction. Numeric.
- InvoiceDate: Invoice date and time. The day and time when a transaction was generated.
- Price: Unit price. Product price per unit in sterling (£).
- CustomerID: Customer number. A 5-digit integral number uniquely assigned to each customer.
- Country: Country name. The name of the country where a customer resides.
Dataset Source: — https://archive-beta.ics.uci.edu/dataset/502/online+retail+ii
Analysis
Data Understanding & Quality
Goal: Can the business rely on this data?
Questions to answer :
- What is the time range of the data?
- How many unique customers, transactions, and products?
- Are there missing or invalid Customer IDs?
- Are there negative quantities or prices (returns, cancellations)?
- How many transactions are refunds vs purchases?
Most of the data is clean, but it has some null values, duplicates, and anomalies in the stock code and description which need to cleaned.
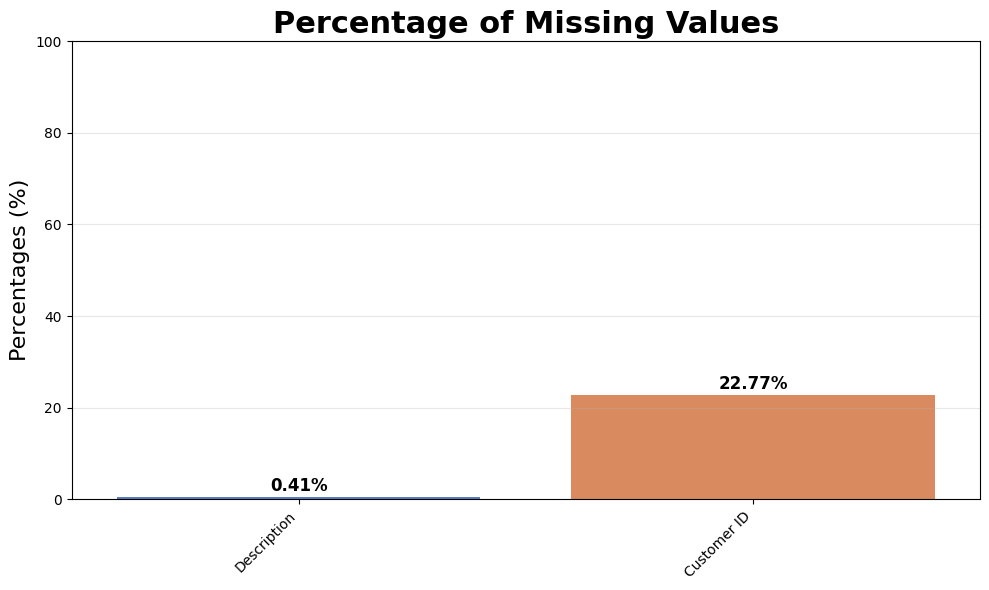
Customer ID has almost 25% of missing values. It’s not recommended to impute such a large percentage of missing values this might cause bias or noise in the analysis. Customer segmentation is purely based on customer behaviour and preference. So it is very important to have accurate data. Description is having very negligible amount of missing values. Since it is a low-impact categorical feature, we have two options: Can drop this as the impact is less, or we can impute as “Unknown” and use it as a categorical feature. In this case i am inputting as “Unknown” for description and dropping the Customer ID.

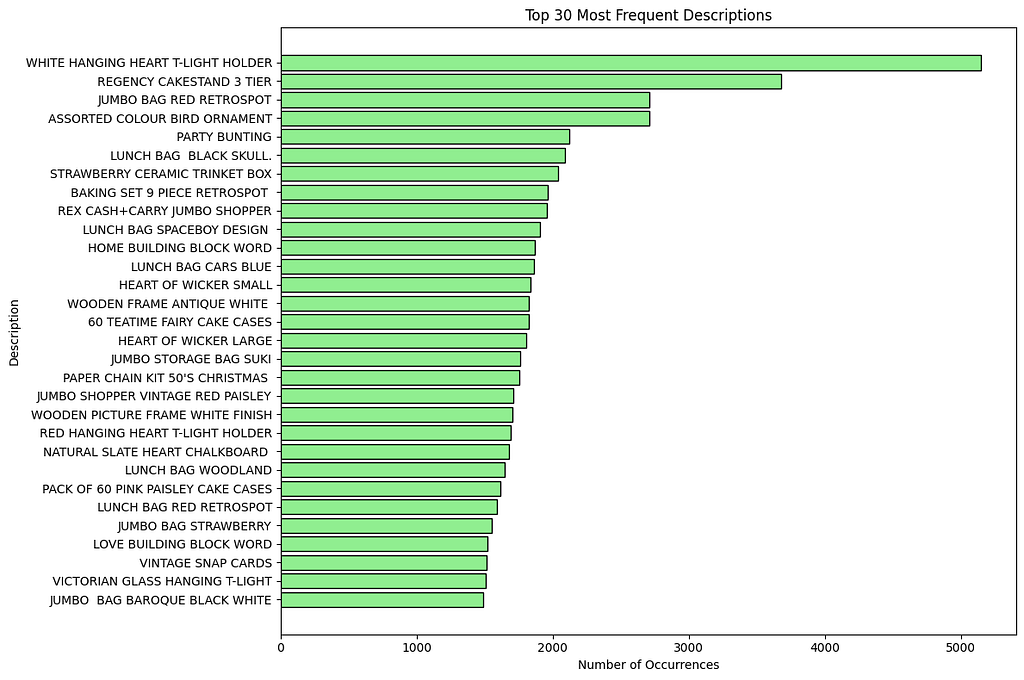
The dataset has 4646 unique stock code that is showing that the there is a different range of products in the dataset. This will be used to understand the behavior of the customer. Exploring the top 10 frequent stock codes will help to determine customer purchase frequency. Let’s check if there is any anomaly in the stock code.
Anomalies in the description columns were cleaned. Standardised the Description column. The final step of the cleaning process filtered out the rows where the price is 0.
Customer Activity Over Time
Goal: Understand overall customer engagement.
Questions to answer :
- How many active customers per month?
- Is customer activity increasing, stable, or declining?
- Are there seasonal patterns in purchases?
- Do we see spikes due to holidays or promotions?


We can see almost similar patterns in both plots. Customer activity and sales are increasing from September to December for both years. Major events like Halloween and Christmas are during that time. We are seeing the spikes due to holidays.
Purchase Behavior
Goal: Understand frequency & value patterns.
Questions to answer :
- How often do customers place orders?
- What is the distribution of purchase frequency?
- What is the average order value (AOV)?
- Are there many one-time buyers?

The Recency plot suggests that there are two types of customer either dormant or active. Almost 1500 customers are purchasing within 50 days, and another movement is near 350–400 days, so this suggests that there are almost 1500 -2000 regular buyers. The next plot shows that the average days between purchases is 0 -5 days, but this is for the repeat customers. Need to see the percentage of repeat customers next.

The pie chart shows that there are almost 75.6 % repeated customers, but we need to check whether they are long-term customers or 2nd purchase / 3rd purchase.

This chart gives us a clear picture. Among the repeated customer most have exactly 2 purchases, and a few have 3 purchases, and dramatically it is getting reduced. So Very few customers become highly loyal (10+ purchases). This indicates there is no long-term relationship with customers.

Almost 50 % of the customers are in 1 -3 purchases.
Monetary Value Analysis
Goal: Identify value concentration.
Questions to answer :
- How is revenue distributed across customers?
- What % of revenue comes from top 10% customers?
- Are high-value customers frequent or infrequent?
- Do a few customers dominate revenue?

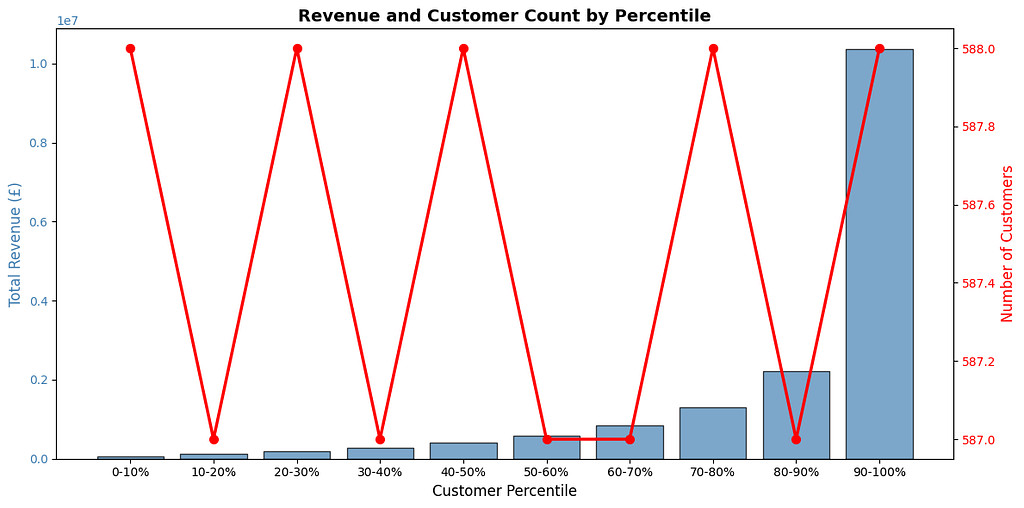
Below is the breakdown of revenue.
– 0–80% customers: £9.3M
– 80–90% customers: £1.3M
– 90–100% customers: £10.4M
As per the plot, the revenue is gradually increasing till 90 %, and there is a sudden increase in the revenue. Top 10 % contributes almost 50 % of revenue. This is an indication of over-reliance on the top 10 %, and if the top 10% churn, then the 50% of the revenue is gone. But there lies an opportunity to understand what makes the top 10% different and replicate their characteristics in the 80–90% segment. This is having massive growth potential.
Recency & Inactivity Patterns
Goal: Understand inactivity before modeling churn.
Questions to answer :
- How long since customers last purchased?
- What does the recency distribution look like?
- Where do natural breakpoints appear (30, 60, 90 days)?
- Does inactivity correlate with lower future spending?

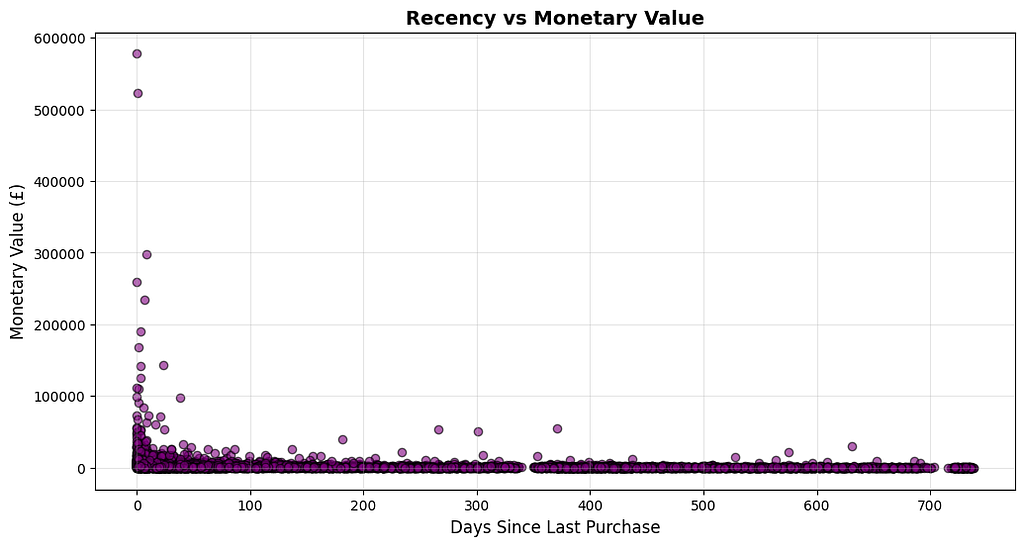
This chart gives a larger picture. 59.2% of customers are at-risk or lost, and Only 40.8% are actively engaged. Different measures need to be introduced to recover the lost or at-risk customers.
This indicates that the top spenders are regularly active and they are buying regularly. We can confirm this only by re-verifying because there is a high chance that the top spenders may be one-time buyers. Let’s verify this.
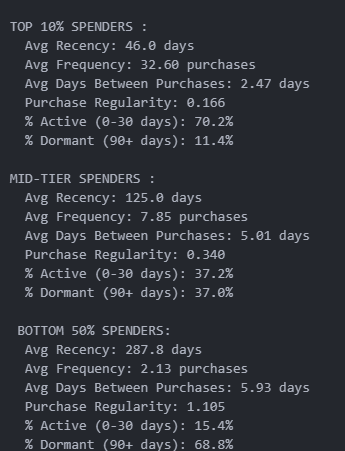
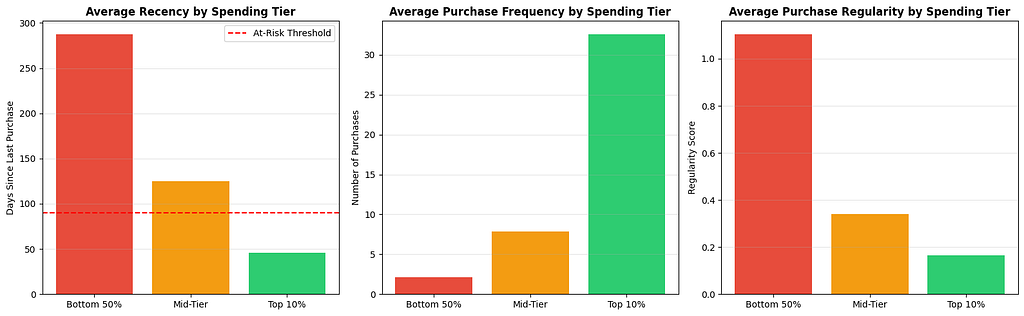
These visuals confirm that the top 10 % are regular buyers, and this also suggests that there is massive growth potential if we are able to convert the bottom 50 % like our top 10%.
RFM Segmentation (Customer Value Lens)
Goal: Segment customers by transactional value.
Questions to answer :
- How do customers distribute across R, F, and M?
- Which RFM segments generate the most revenue?
- Are there high-value but low-recency customers?
- Which segments are shrinking over time?

The heatmap indicates that around 574 top buying customers are dormant now. Need to find out the reasons why they became inactive and if we are able to return them its a huge advantage.
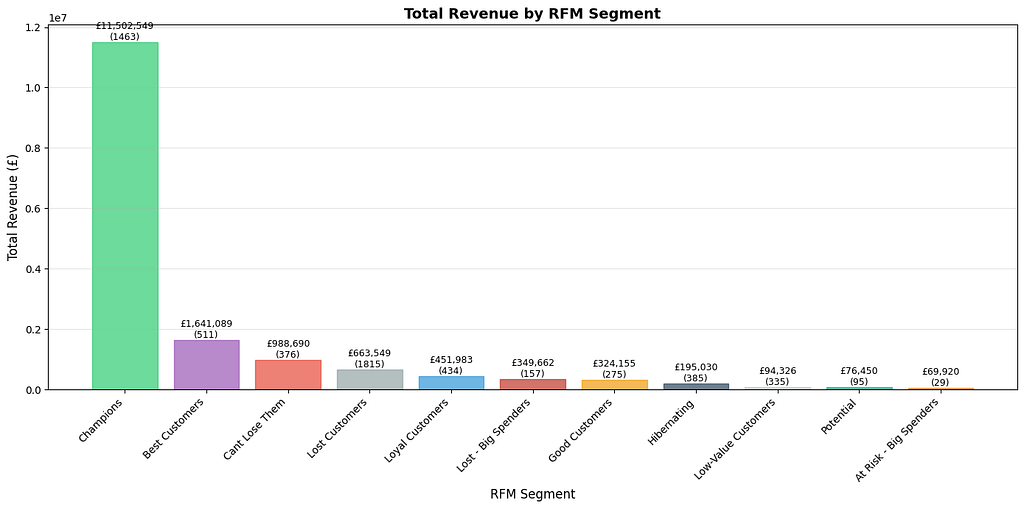
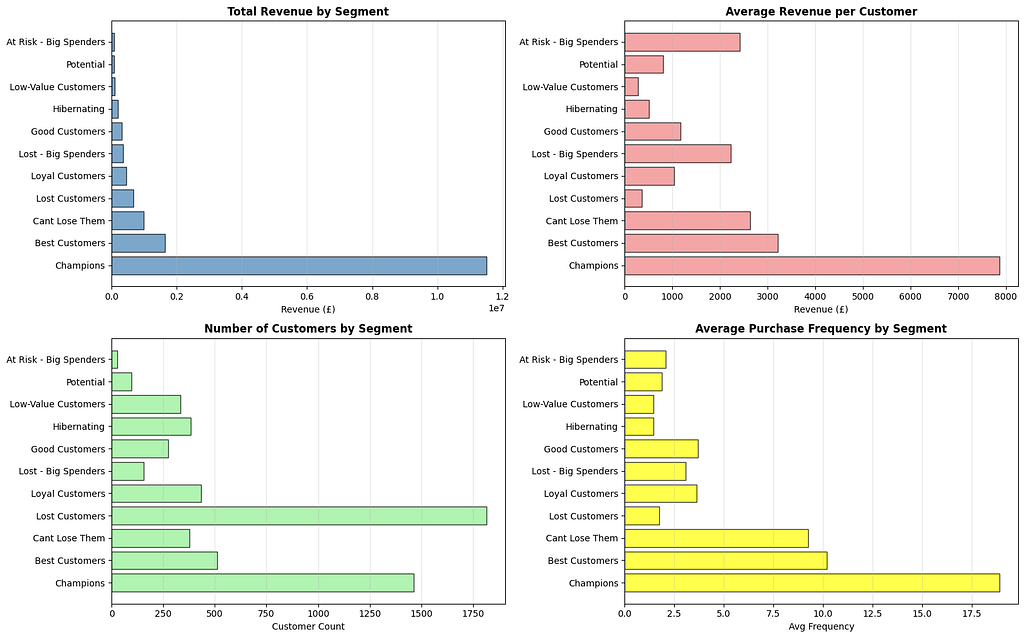
These charts indicate the same problem. Champions — Customer is running the show, and the business is very much dependent on them. Need to bring back the lost top buyers. Need to develop a different strategy for each customer type.

This plot indicates that we are losing customers and are facing a retention crisis.
Behavioural Stability (RSS) Analysis
Goal: Identify unstable vs predictable customers.
Questions to answer :
- Do customers spend consistently or erratically?
- Is spending increasing or decreasing over time?
- How variable are purchase intervals?
- Which segments show declining engagement trends?
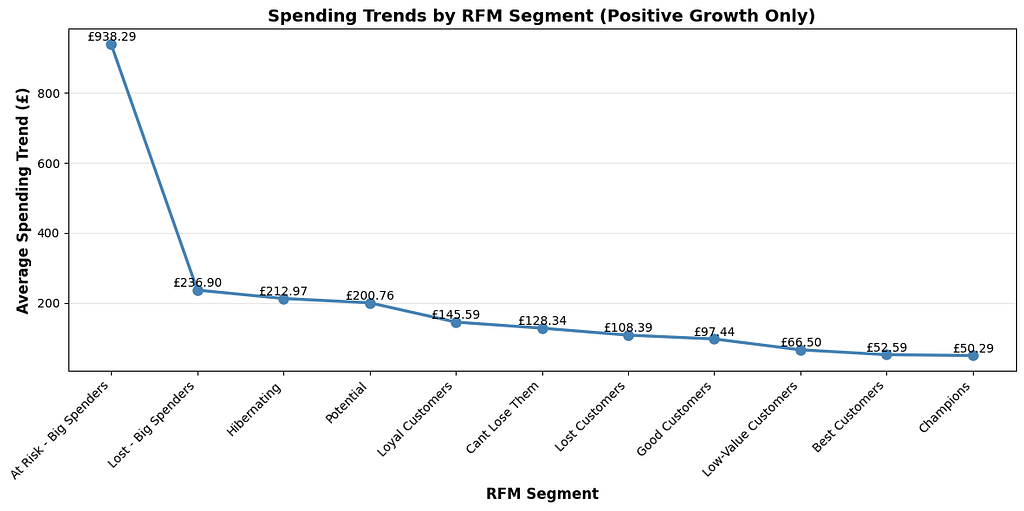
This plot is indicating best customers aren’t growing their spending. At-risk customers are spiking in spending that might be the big purchase before they churn.

This plot shows that even though the champions are regular buyers and active, it is difficult to predict the exact timing of purchase. Champions are amazing customers, but cannot manage them blindly because they can’t predict their behavior.

The churn problem is not much related to spending. The spending trend range is identical, and there is no correlation.
Churn Label Exploration
Goal: Validate churn definition.
Questions to answer :
- What % of customers are labeled as churned?
- How does churn vary across RFM segments?
- Are high-value customers churning less or more?
- Does churn correlate with recency gaps?
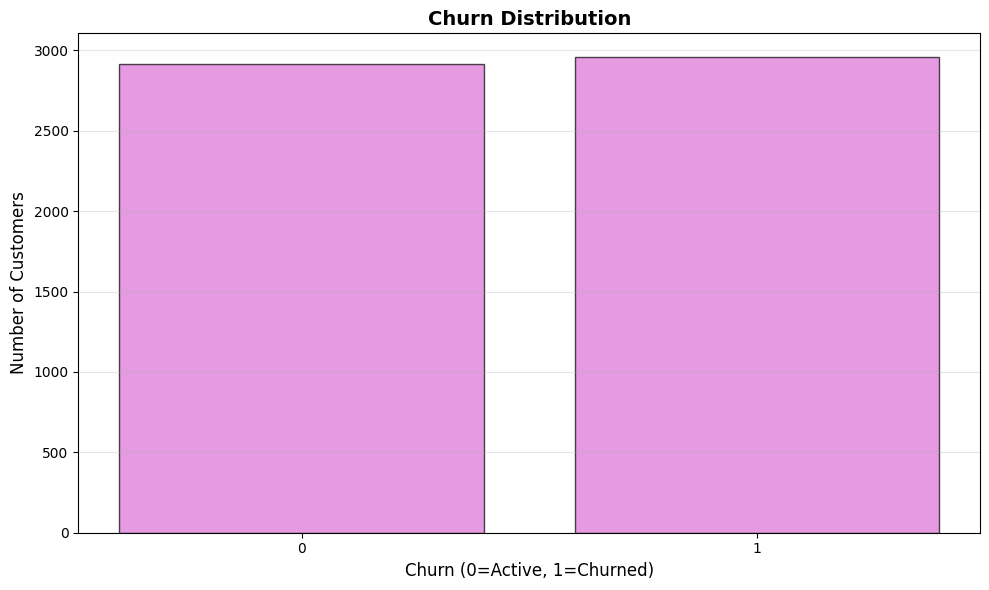
More that 50 % of customers have churned overall. Many low-engagement customers churn, and few Champions churn

As expected, the Champions havea perfect 0% retention. Need to work on Best, Good and Hibernating customers.
Segment × Churn × Value Matrix
Goal: Tie everything together.
Questions to answer :
- Which segments have high churn and high value?
- Which segments have low churn but low value?
- Where should retention budget be spent?
- Where should we avoid intervention?
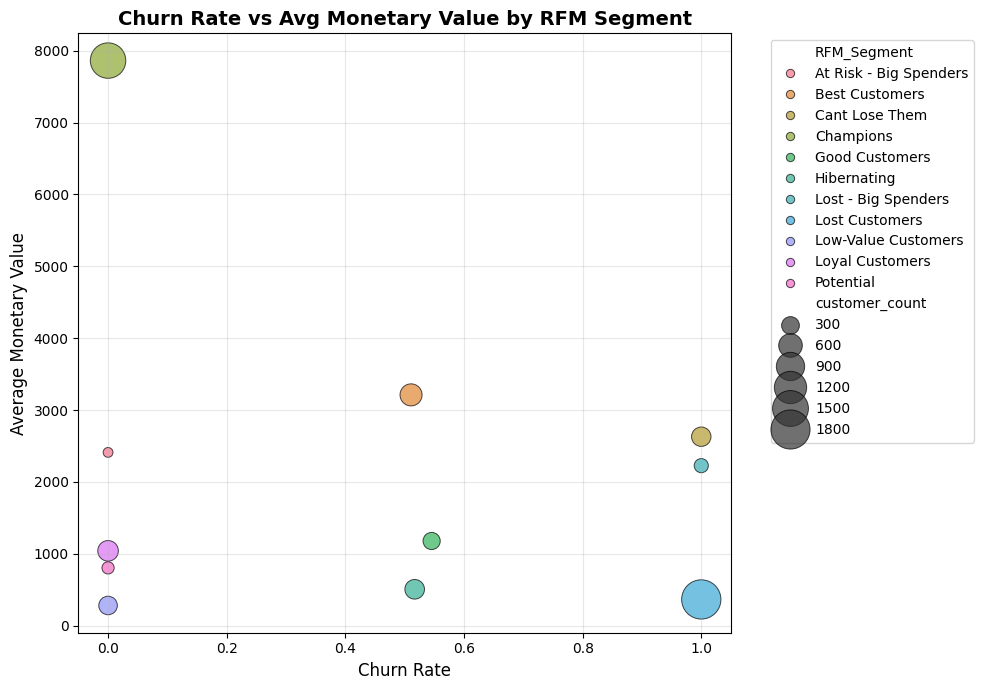
This plot indicates that there is a conversation threshold, not a retention problem.

Actionable Business Decisions
Goal: Convert analysis into strategy.
Questions to answer :
- Who should get retention offers?
- Who should get early access to new features?
- Who is likely to churn regardless of intervention?
- What is the expected business impact of acting?
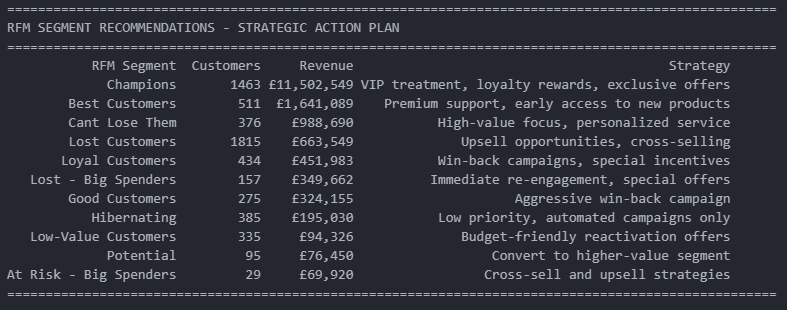
The business is totally dependent on the top-most best customers, and it is failing to convert the 75% of other tier customers, and that is resulting in a more than 50 % churn rate. The actual problem is the conversion rate and not retention. In order to recover, below Four strategic initiatives are recommended.
– Make the top-most best customers happy with VIP programs.
– Recover the dormant customer who was previously the top-most best customers through win-back campaigns
– Fix conversion pipeline for Best/Good customers
– Implement a visibility system to predict churn
Conclusion
This analysis is part of my end-to-end project for customer segmentation and retention strategy built on transactional data, combining RFM-based analytics, churn modelling, deployment, and monitoring to support data-driven retention decisions. Still, the project is ongoing. Need to complete the model training and then convert the project fully withthe life cycle of Model which includes Training, Evaluation, Deployment, Monitoring and Maintenance.
Hope you have liked the analysis. For a more detailed analysis, kindly refer to my repo.
Kaggle Notebook: Customer Segmentation & Retention Analysis
Cheers,
Samith Chimminiyan
Customer Segmentation and Retention Strategy using Transactional Data was originally published in Towards AI on Medium, where people are continuing the conversation by highlighting and responding to this story.