
Building a Trusted Semantic Layer with Snowflake Horizon Context
Part 2 of series on implementing Snowflake Horizon Context in production
AI Cannot Be Trusted If Metrics Cannot Be Trusted
In Part 1, we established why enterprise AI struggles: context fragmentation means the same question yields different answers depending on which system resolves it. Snowflake Horizon Context addresses this architecturally — but architecture without implementation is just a diagram on a whiteboard.
This article is where we build. We’ll design domain-oriented Semantic Views, implement metric certification workflows, establish governance at the meaning layer, define organizational responsibilities, and walk through the production patterns that separate a proof-of-concept from an enterprise deployment.
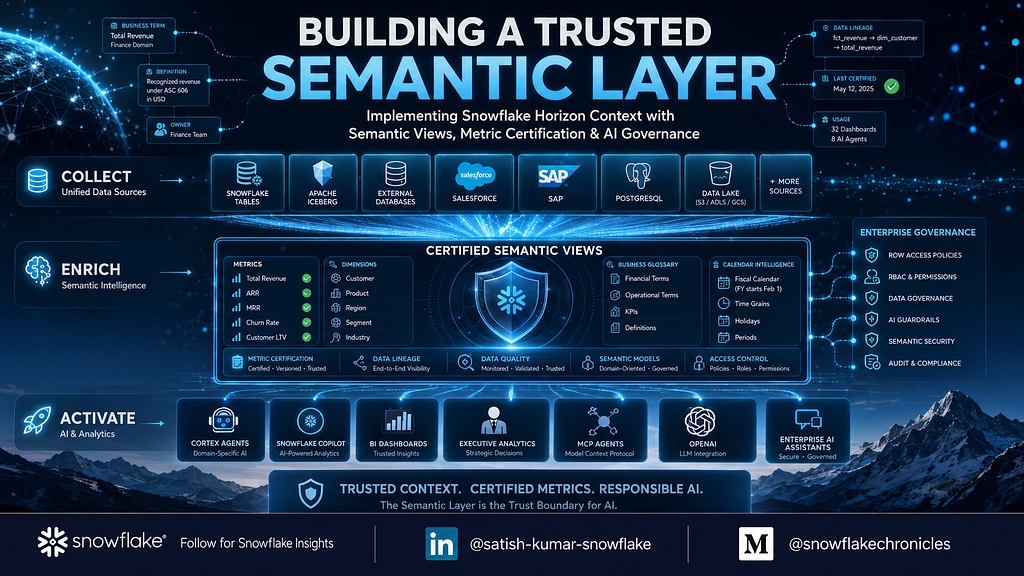
The central claim of this article: the semantic layer is the trust boundary for AI. If your metrics aren’t governed, versioned, and certified, then your AI agents are making financial decisions based on unvalidated definitions. That’s not an AI problem. That’s a governance failure.
Why Semantic Views Matter
A Semantic View is more than a database view with a description attached. It’s a governed business interface that declares:
- What metrics exist and how they’re calculated
- What dimensions are available for analysis
- How tables relate to each other (explicit join paths)
- What time grains and fiscal calendars apply
- Who owns each definition and when it was last certified
- What access policies govern consumption
When Cortex Context (the AI orchestration engine) needs to answer “What was Q3 revenue by region?”, it doesn’t scan raw tables and infer meaning. It reads the Semantic View, finds the certified total_revenue metric, understands that Q3 maps to the fiscal calendar starting in February, knows the join path to the customer dimension for regional breakdown, and generates a governed query.
Without Semantic Views, AI guesses. With them, AI knows.
Designing Domain-Oriented Semantic Models
The first design decision: how to partition your semantic layer.
We strongly recommend domain orientation over monolithic models:
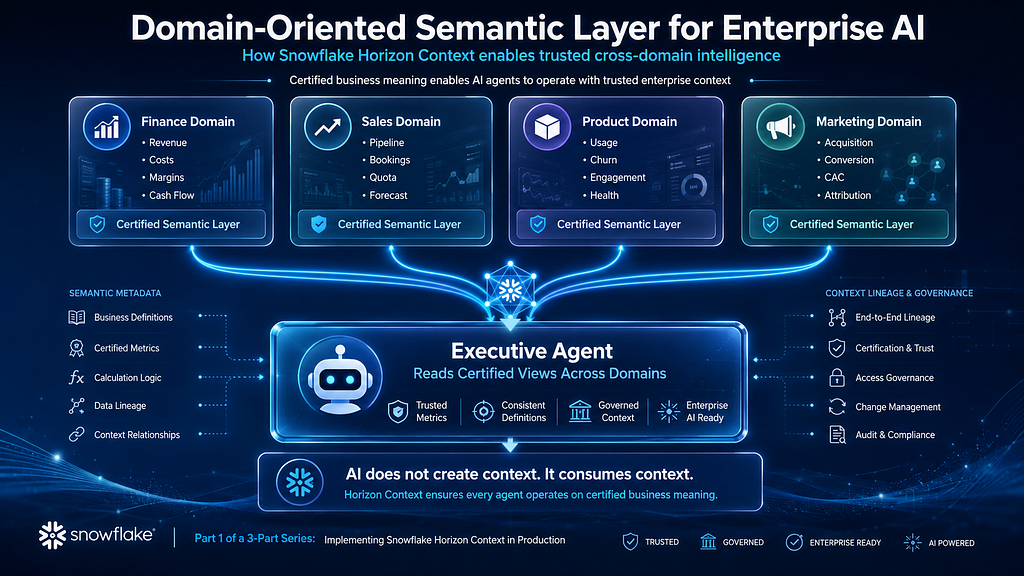
Why domain orientation:
- Ownership clarity. Each domain has a single team accountable for definitions. Finance owns revenue metrics. Product owns churn metrics. No ambiguity.
- Independent evolution. The Sales team can iterate on pipeline metrics without blocking Finance’s certification cycle.
- Scoped complexity. A single Semantic View for the entire enterprise would be unmanageable. Domain views are tractable.
- AI agent alignment. Domain-specific agents (Finance Agent, Sales Agent) map cleanly to domain-specific Semantic Views.
Architect Note: Start with revenue, ARR, churn, and active users. These four metrics typically generate the highest semantic confusion and the fastest ROI. Don’t try to model your entire business on day one.
Revenue Semantic View: A Complete Walkthrough
Here’s a production-grade Semantic View for the Finance revenue domain. Every decision is annotated.
name: finance_revenue
description: >
  Certified revenue metrics for the Finance domain.
  All revenue figures follow ASC 606 recognition rules.
  Fiscal year starts February 1. All amounts in USD
  after currency conversion at daily spot rates.
tables:
  - name: fct_revenue
    base_table: analytics.marts.fct_revenue
    description: >
      Fact table containing recognized revenue transactions.
      One row per revenue recognition event. Grain: transaction-level.
    columns:
      - name: revenue_id
        description: Unique identifier for each revenue recognition event
        data_type: VARCHAR
      - name: recognized_date
        description: >
          Date revenue was recognized per ASC 606 rules.
          This is NOT the booking date or invoice date.
        data_type: DATE
      - name: amount_usd
        description: >
          Revenue amount in USD. Converted from local currency
          at daily spot rate on recognition date.
        data_type: NUMBER(18,2)
      - name: customer_id
        description: Foreign key to dim_customer
        data_type: VARCHAR
      - name: product_line
        description: >
          Product categorization. Values: Platform, Services, Add-ons.
          Platform = core subscription. Services = professional services.
          Add-ons = optional product extensions.
        data_type: VARCHAR
      - name: is_recurring
        description: >
          TRUE if revenue is from a subscription contract.
          FALSE for one-time services, implementation fees, overages.
        data_type: BOOLEAN
      - name: contract_id
        description: Source contract identifier from billing system
        data_type: VARCHAR
  - name: dim_customer
    base_table: analytics.marts.dim_customer
    description: >
      Customer dimension. One row per customer account.
      Segmentation based on current ARR tier.
    columns:
      - name: customer_id
        data_type: VARCHAR
      - name: customer_name
        data_type: VARCHAR
      - name: segment
        description: >
          Enterprise: ARR > $100K.
          Mid-Market: ARR $25K-$100K.
          SMB: ARR < $25K.
          Segments reassessed quarterly.
        data_type: VARCHAR
      - name: region
        description: >
          Geographic region based on billing address.
          Values: AMER, EMEA, APAC, LATAM.
        data_type: VARCHAR
      - name: industry
        description: NAICS-based industry classification
        data_type: VARCHAR
relationships:
  - name: revenue_to_customer
    left_table: fct_revenue
    right_table: dim_customer
    join_type: many_to_one
    on:
      - left_column: customer_id
        right_column: customer_id
    description: >
      Every revenue event belongs to exactly one customer.
      Orphan revenue records (customer_id IS NULL) are excluded
      from all metrics and investigated by data quality team.
metrics:
  - name: total_revenue
    description: >
      Total recognized revenue in USD across all product lines.
      Includes recurring and non-recurring. Excludes deferred
      revenue, credits, and refunds (handled in separate metrics).
    expression: SUM(fct_revenue.amount_usd)
    certified: true
    owner: finance-data-team@company.com
    last_certified: "2025-12-15"
  - name: recurring_revenue
    description: >
      Revenue from subscription contracts only (is_recurring = TRUE).
      This is the numerator for MRR and ARR calculations.
      Does NOT include overage charges even on subscription contracts.
    expression: >
      SUM(CASE WHEN fct_revenue.is_recurring = TRUE
           THEN fct_revenue.amount_usd ELSE 0 END)
    certified: true
    owner: finance-data-team@company.com
    last_certified: "2025-12-15"
  - name: arr
    description: >
      Annual Recurring Revenue. Current month's recurring revenue
      multiplied by 12. Point-in-time metric - always computed
      from the most recent COMPLETE month. Do not use partial
      month data. This is the company's primary growth metric
      reported to the board.
    expression: >
      SUM(CASE WHEN fct_revenue.is_recurring = TRUE
           THEN fct_revenue.amount_usd ELSE 0 END) * 12
    default_filters:
      - column: recognized_date
        operator: between
        value: "FIRST DAY OF PREVIOUS COMPLETE MONTH to LAST DAY OF PREVIOUS COMPLETE MONTH"
    certified: true
    owner: cfo-office@company.com
    last_certified: "2025-12-01"
  - name: mrr
    description: >
      Monthly Recurring Revenue. Same as recurring_revenue when
      filtered to a single month. Reported monthly to investors.
    expression: >
      SUM(CASE WHEN fct_revenue.is_recurring = TRUE
           THEN fct_revenue.amount_usd ELSE 0 END)
    default_filters:
      - column: recognized_date
        operator: within
        value: "MOST RECENT COMPLETE MONTH"
    certified: true
    owner: finance-data-team@company.com
  - name: gross_margin
    description: >
      (Total Revenue - COGS) / Total Revenue. COGS sourced from
      finance_costs semantic view. Cross-domain metric - requires
      join to costs domain.
    expression: >
      (SUM(fct_revenue.amount_usd) - SUM(costs.cogs_amount)) /
      NULLIF(SUM(fct_revenue.amount_usd), 0)
    certified: true
    owner: finance-data-team@company.com
    dependencies:
      - semantic_view: finance_costs
        metric: total_cogs
  - name: net_revenue_retention
    description: >
      NRR measures revenue retained and expanded from the existing
      customer base. Trailing 12-month calculation. Denominator:
      recurring revenue from customers active 12 months ago.
      Numerator: current recurring revenue from those same customers.
      Target: >110% for Enterprise, >100% for SMB.
    expression: >
      SUM(current_period_recurring) /
      NULLIF(SUM(base_period_recurring), 0)
    certified: true
    owner: finance-data-team@company.com
time_dimensions:
  - name: recognized_date
    table: fct_revenue
    column: recognized_date
    time_grains: [day, week, month, quarter, year]
    fiscal_year_start_month: 2
    description: >
      Primary time dimension. Fiscal year starts February 1.
      Q1 = Feb-Apr, Q2 = May-Jul, Q3 = Aug-Oct, Q4 = Nov-Jan.
filters:
  - name: product_line
    table: fct_revenue
    column: product_line
    description: Filter by product line (Platform, Services, Add-ons)
  - name: customer_segment
    table: dim_customer
    column: segment
    description: Filter by customer segment (Enterprise, Mid-Market, SMB)
  - name: region
    table: dim_customer
    column: region
    description: Filter by geographic region (AMER, EMEA, APAC, LATAM)
  - name: industry
    table: dim_customer
    column: industry
    description: Filter by customer industry
Design Decisions Explained
Why so much description text? Because Cortex Context reads these descriptions when resolving ambiguity. When a user asks “What’s our subscription revenue?”, Cortex Context needs enough context in the metric description to determine that recurring_revenue is the right metric — not total_revenue. Sparse descriptions force AI to guess.
Why explicit fiscal calendar rules? Because “Q3” means different things in different fiscal calendars. With February fiscal year start, Q3 is August through October. Without this declaration, Cortex Context would default to calendar Q3 (July-September) and return wrong numbers to the CEO.
Why declare join relationships explicitly? Because AI agents are notorious for generating incorrect multi-table joins. By declaring that fct_revenue.customer_id joins to dim_customer.customer_id as a many-to-one relationship, we prevent Cortex Context from ever generating a query that produces row duplication through a bad join.
Churn Semantic View Walkthrough
Churn is the metric most likely to have competing definitions in your organization. Here’s how to handle it:
name: product_churn
description: >
  Customer churn and retention metrics based on PRODUCT ACTIVITY.
  A customer is churned if they have zero platform activity
  (no logins, no API calls, no data processed) for 90 consecutive
  days. This is the PRODUCT definition of churn.
IMPORTANT: This differs from the SALES definition of churn
  (contract non-renewal). For contract-based churn, see the
  sales_churn semantic view owned by revenue-ops@company.com.
  Both definitions are valid for different analytical purposes.
  When in doubt, ask the user which definition they need.
metrics:
  - name: churned_customers
    description: >
      Count of customers with zero platform activity for 90+
      consecutive days. Excludes: (1) customers in first 30 days
      of onboarding, (2) accounts flagged as seasonal by Customer
      Success, (3) accounts in planned migration/downtime.
    expression: >
      COUNT(DISTINCT CASE
        WHEN days_since_last_activity > 90
        AND days_since_signup > 30
        AND NOT is_seasonal_account
        AND NOT is_in_planned_downtime
        THEN customer_id
      END)
    certified: true
    owner: product-analytics@company.com
    last_certified: "2025-11-20"
  - name: churn_rate
    description: >
      Monthly gross churn rate. Denominator: customers active at
      start of month. Numerator: customers who crossed the 90-day
      inactivity threshold during that month. Expressed as a
      percentage. Industry benchmark for B2B SaaS: <2% monthly.
    expression: >
      churned_customers_in_period /
      NULLIF(active_customers_at_period_start, 0)
    certified: true
    owner: product-analytics@company.com
Notice the explicit callout: “This differs from the SALES definition.” This is intentional. When Cortex Context encounters a question about churn, it needs to understand that multiple valid definitions exist and which one to use — or when to ask the user for clarification.
The Certification Framework
A metric without certification is just an opinion with SQL. Certification is what transforms a metric from “something an analyst wrote” into “the organization’s agreed-upon truth.”
Certification Lifecycle
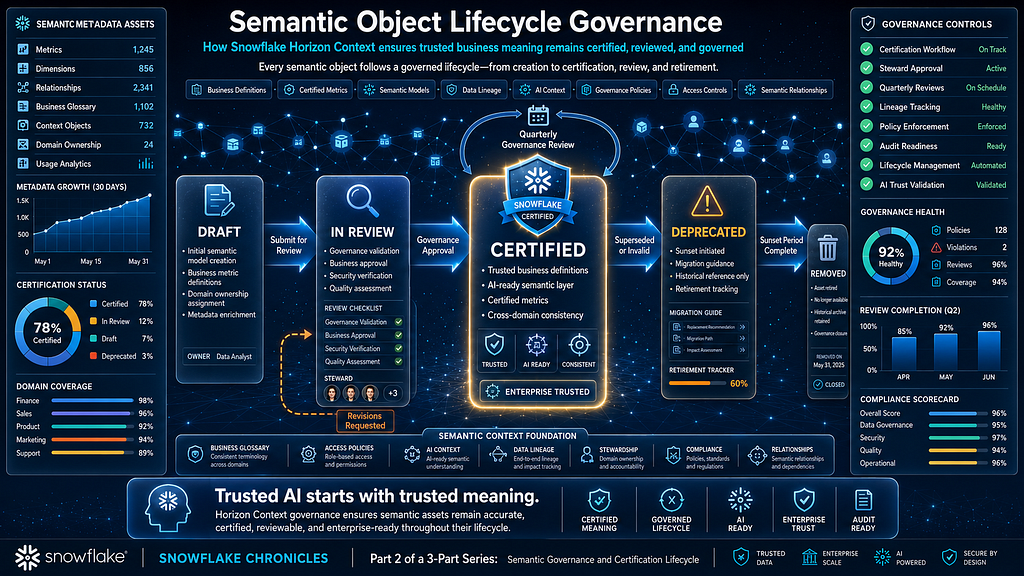
Certification Requirements
Before a metric can be certified:
- Business definition is unambiguous. Anyone reading the description understands exactly what’s included and excluded.
- Technical implementation matches definition. The SQL expression produces results consistent with the stated business rules.
- Owner is identified. A named individual or team is accountable for accuracy.
- Validation tests pass. Automated tests confirm the metric matches the system of record (e.g., Finance’s closed books).
- Stakeholders have reviewed. Consuming teams (BI, AI, executive reporting) agree the definition serves their needs.
Tracking Certifications
CREATE OR REPLACE TABLE governance.semantic.metric_certifications (
    metric_name VARCHAR NOT NULL,
    semantic_view VARCHAR NOT NULL,
    domain VARCHAR NOT NULL,
    business_definition TEXT NOT NULL,
    technical_expression TEXT NOT NULL,
    certified_by VARCHAR NOT NULL,
    certification_date TIMESTAMP_NTZ NOT NULL,
    next_review_date TIMESTAMP_NTZ NOT NULL,
    status VARCHAR NOT NULL DEFAULT 'draft',
    deprecation_reason TEXT,
    replacement_metric VARCHAR,
    CONSTRAINT valid_status CHECK (status IN ('draft', 'in_review', 'certified', 'deprecated'))
);

CREATE OR REPLACE TABLE governance.semantic.certification_audit (
    audit_id VARCHAR DEFAULT UUID_STRING(),
    metric_name VARCHAR NOT NULL,
    semantic_view VARCHAR NOT NULL,
    action VARCHAR NOT NULL,
    performed_by VARCHAR NOT NULL,
    action_timestamp TIMESTAMP_NTZ DEFAULT CURRENT_TIMESTAMP(),
    previous_definition TEXT,
    new_definition TEXT,
    reason TEXT
);
Production Reality: Certification isn’t a one-time event. It’s a cadence. We recommend quarterly reviews for all certified metrics. Market conditions change, business rules evolve, and what was true last quarter may not be true today. Build the review cadence into your governance council’s calendar from day one.
Governance at the Meaning Layer
Traditional governance focuses on access: who can see which tables. Semantic governance extends this to meaning: who can define what data means, and how those definitions flow to consumers.
Four Levels of Data Governance
Level Question Traditional Approach Horizon Context Approach 1. Access Who can see the data? RBAC, row policies RBAC + semantic view permissions 2. Quality Is the data correct? DMFs, tests DMFs + semantic validation tests 3. Semantics What does it mean? Wiki pages, glossaries Certified Semantic Views 4. AI How is meaning consumed by AI? (nothing) Agent-metric binding, confidence thresholds
Most organizations operate at Levels 1–2. Horizon Context enables Levels 3–4 — which is where AI trust lives.
Semantic Access Control
It’s not sufficient to control table access. You must control semantic definition access:
- Who can create Semantic Views? Only Analytics Engineering (authoring role)
- Who can certify metrics? Only the Governance Council (certification role)
- Who can consume certified metrics via AI? Production agents with explicit binding
- Who can modify a certified metric? Only through the CI/CD pipeline with review
-- Governance role hierarchy for semantic assets
CREATE ROLE IF NOT EXISTS semantic_author;    -- Can create/modify views in dev
CREATE ROLE IF NOT EXISTS semantic_certifier; -- Can approve for production
CREATE ROLE IF NOT EXISTS semantic_consumer;  -- Can query certified views
CREATE ROLE IF NOT EXISTS semantic_admin;     -- Full control

GRANT ROLE semantic_author TO ROLE analytics_engineering;
GRANT ROLE semantic_certifier TO ROLE data_governance_council;
GRANT ROLE semantic_consumer TO ROLE cortex_agents;
GRANT ROLE semantic_admin TO ROLE data_platform_admin;
Row-Level Security Through Semantic Views
Access policies apply at the semantic layer — meaning AI agents automatically respect them without needing policy-aware prompts:
CREATE OR REPLACE ROW ACCESS POLICY governance.policies.region_access
AS (region VARCHAR) RETURNS BOOLEAN ->
    IS_ROLE_IN_SESSION('FINANCE_ADMIN')
    OR region = CURRENT_SESSION_CONTEXT('REGION');

ALTER TABLE analytics.marts.fct_revenue
    ADD ROW ACCESS POLICY governance.policies.region_access ON (region);
When the EMEA Sales Director asks the Finance Agent “What was Q3 revenue?”, they see $41.1M (EMEA only). When the CFO asks the same question, they see $142.3M (global). Same agent, same Semantic View, same metric — different access context. No prompt engineering required.
The RACI Model
Clear ownership prevents the “everybody’s job is nobody’s job” failure mode:
| Activity             | Data Governance | Data Engineering | Analytics Engineering | BI Teams | AI Engineering | Security |
| -------------------- | :-------------: | :--------------: | :-------------------: | :------: | :------------: | :------: |
| Define Metrics       |        C        |         I        |           R           |     C    |        I       |     I    |
| Certify Metrics      |        C        |         I        |           I           |     R    |        I       |     I    |
| Build Semantic Views |        I        |         C        |           R           |     C    |        I       |     I    |
| Configure Connectors |        I        |         R        |           C           |     I    |        I       |     I    |
| Manage Lineage       |        C        |         R        |           C           |     I    |        I       |     I    |
| Build AI Agents      |        I        |         C        |           I           |     I    |        R       |     I    |
| Set Access Policies  |        C        |         I        |           I           |     I    |        I       |     R    |
| Monitor Usage        |        R        |         C        |           C           |     C    |        C       |     I    |
| Deprecate Metrics    |        A        |         I        |           R           |     C    |        I       |     I    |
What This Matrix Reveals
- Data Governance provides the trust layer by defining standards, managing lineage, and governing metrics.
- Analytics Engineering turns raw data into business meaning through Semantic Views and governed metrics.
- Data Engineering builds the foundation with connectors, pipelines, and reliable data movement.
- BI Teams validate that metrics and definitions accurately reflect business reality.
- AI Engineering creates agents and copilots powered by trusted, governed context.
- Security ensures the right people have access to the right data at the right time.
Takeaway
Snowflake Horizon isn’t owned by a single team — it’s a team sport.
- Data Governance → Trust
- Data Engineering → Data Flow
- Analytics Engineering → Business Meaning
- BI Teams → Validation
- AI Engineering → Intelligence
- Security → Protection
Common Semantic Modeling Mistakes
Mistake 1: One Giant Semantic View
What happens: Team creates a single Semantic View with 200 metrics, 50 tables, and 30 relationships. It becomes unmaintainable. Nobody can certify it because nobody understands all of it.
Fix: Domain-oriented models. One Semantic View per business domain. Max 15–20 metrics per view. Cross-domain metrics reference other views explicitly.
Mistake 2: Metrics Without Business Context
What happens: Metric description says “SUM(amount_usd)” — which is the expression, not the definition. AI can’t distinguish this metric from any other sum.
Fix: Every description must answer: What’s included? What’s excluded? What are the boundary conditions? Who should use this vs. an alternative metric?
Mistake 3: Implicit Join Paths
What happens: Semantic View doesn’t declare relationships. AI infers joins from column names (customer_id matches customer_id). Sometimes this produces Cartesian products on tables with composite keys.
Fix: Declare every relationship explicitly with join type (one-to-one, many-to-one, many-to-many). AI should never infer join paths.
Mistake 4: Missing Time Context
What happens: Metric works correctly for “last month” but fails for “Q3” because fiscal calendar isn’t declared. AI defaults to calendar quarters.
Fix: Always declare fiscal year start month, supported time grains, and any custom period logic (e.g., 4–4–5 retail calendar).
Mistake 5: Certifying Too Fast
What happens: Team certifies metrics before BI teams have validated them against existing dashboards. Inconsistencies emerge post-certification, eroding trust.
Fix: Certification requires sign-off from at least one consuming team. Run parallel: compute the metric from both the Semantic View and the existing BI tool. They must match within a defined tolerance before certification.
Production Best Practices
1. Version your semantic models in Git. Semantic Views are code. They need branches, pull requests, reviews, and rollback capability. Never edit production semantic views directly.
2. Test against closed books. For financial metrics, validate against the Finance team’s system of record after each month-end close. Automated CI tests should catch drift before it reaches production.
3. Deprecate gracefully. When a metric definition changes, don’t delete the old one. Mark it deprecated with a 30-day sunset window. Update the description to point to the replacement. Notify consuming teams.
4. Start narrow, go deep. It’s better to have 5 perfectly certified metrics than 50 draft metrics. Quality compounds trust. Quantity without governance compounds confusion.
5. Make AI agents ask, not guess. Configure confidence thresholds. When Cortex Context’s semantic resolution confidence is below 80% (e.g., ambiguous between two metrics), the agent should ask the user for clarification rather than choosing one silently.
Lessons Learned
Lesson Learned: The hardest conversation in semantic modeling isn’t about SQL. It’s getting the VP of Sales and the CFO to agree on one number. Plan for this. Budget calendar time for alignment meetings. The Semantic View will reflect whatever political resolution emerges — and that’s fine. The point is to make the resolution explicit and discoverable, not hidden in a spreadsheet somewhere.
Production Reality: After deploying semantic views for revenue metrics, one enterprise discovered 23 different calculated fields across Tableau workbooks that each defined “revenue” slightly differently. Seventeen of them were producing numbers that appeared in executive reports. The metadata connector surfaced these discrepancies in week one — before any AI agent was deployed. The governance value of connectors alone justified the project.
Architect Note: Don’t wait for perfect definitions to start building. Ship a “v1” Semantic View with your best understanding. Let consuming teams validate it. Iterate. Certification is the end of a process, not a prerequisite for starting. Draft views are useful — they just shouldn’t power production AI agents.
TL;DR
- Semantic Views are governed business interfaces — not just database views with descriptions
- Design domain-oriented models: one Semantic View per business domain, max 15–20 metrics each
- Every metric needs: unambiguous business definition, technical expression, named owner, certification date, and review cadence
- Certification is a lifecycle (Draft → In Review → Certified → Deprecated), not a one-time stamp
- Governance must extend to the meaning layer: control who defines metrics, who certifies them, and how AI agents consume them
- Analytics Engineering owns authoring. Governance owns certification. AI Engineering owns consumption.
- Start with 5 high-value metrics. Certify them properly. Expand from a position of trust.
Next in Part 3: We activate the semantic layer for AI — building Cortex Agents, configuring Cortex Context resolution flows, integrating MCP for external AI systems, implementing DevOps for semantic assets, and deploying the full observability stack for production monitoring.
If this was useful — give it a clap 👏, share it with someone building on Snowflake, and subscribe to Snowflake Chronicles so you don’t miss the next one. Every piece is practitioner-first and production-focused. Let’s connect on LinkedIn.
Disclaimer: All views expressed are my own and do not reflect those of any current or former employer.
Follow Snowflake Chronicles for production-ready implementation guides, architecture deep dives, and practical lessons learned from enterprise data platforms.
Building a Trusted Semantic Layer with Snowflake Horizon Context was originally published in Towards AI on Medium, where people are continuing the conversation by highlighting and responding to this story.