
I Built a Production Earthquake Monitoring Pipeline for Indonesia — Here’s What I Learned
How DuckDB, dbt, and GitHub Actions turned a public BMKG API into an automated data warehouse with built-in observability
1. Introduction: Why Indonesia Made Me Care About Data Freshness
Indonesia sits on the Pacific Ring of Fire. It is one of the most seismically active regions on Earth, averaging thousands of earthquakes per year — many of them unfelt, some of them catastrophic. The national meteorology and geophysics agency, BMKG (Badan Meteorologi, Klimatologi, dan Geofisika), monitors all of this in near real-time and publishes a public API.
I’ve always been curious: what does earthquake activity actually look like as a data problem? Not from a seismology standpoint — but from a data engineering one. Can I take a raw API endpoint and build something that’s reliable enough to trust? Something that tells me not just what happened, but also whether the data itself is any good?
That curiosity turned into a weekend project. The weekend project turned into a pipeline. And the pipeline taught me more about production data engineering than any tutorial ever did.
2. The Problem Worth Solving
The BMKG API is simple: hit one endpoint, get the N most recent earthquake events as a JSON file. Clean, accessible, free.
But there’s a catch — actually, a few of them.
The API is stateless. Every time you call it, you get a snapshot of recent events. There’s no historical archive, no pagination, no event log. If your pipeline misses a run, those events are gone. Forever.
Duplicates happen. The same earthquake event can appear in multiple API calls with slightly different attributes as BMKG refines its readings. Without deduplication logic, you end up counting the same M5.2 earthquake five times.
Data quality is invisible. When you pull data from an external API, you’re trusting it blindly. What if the freshness degrades? What if a bad record slips through with an impossible magnitude? Without observability baked in, you’d never know until someone asked a question your pipeline couldn’t answer.
The engineering problem, then, was this: how do you build a reliable, auditable, observable pipeline on top of an ephemeral polling API?
3. Architecture Overview
The solution I landed on follows a layered medallion architecture — a design pattern borrowed from data warehouse thinking, applied to a small-scale but production-grade use case.
Here’s the full flow:
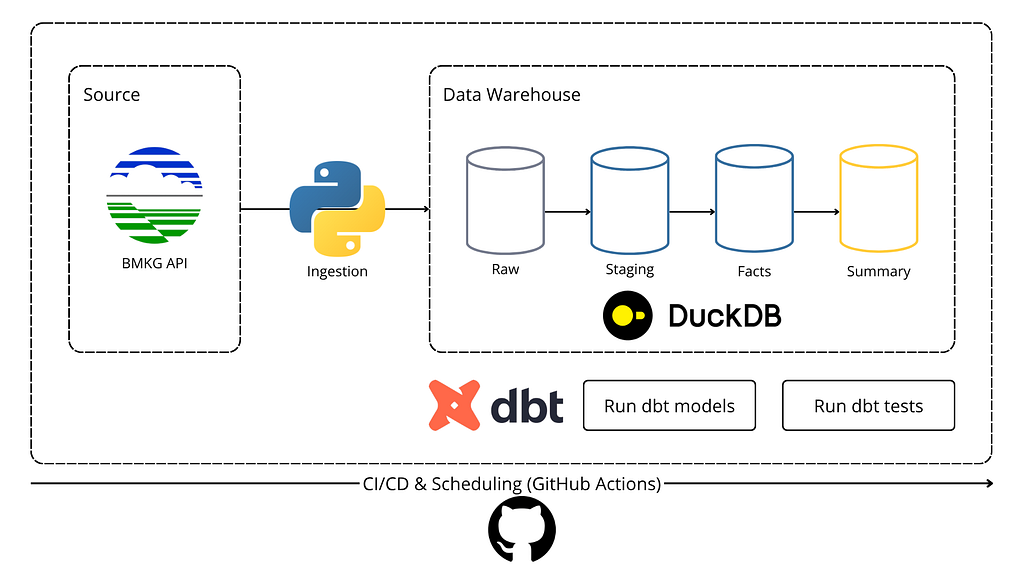
The stack is intentionally lightweight. DuckDB handles all the OLAP workload without needing a server. dbt handles the transformation layer with version-controlled SQL models. GitHub Actions handles both scheduling and quality gates.
Everything runs on one repo, zero cloud bills.
4. From Raw API to Clean Facts
The Ingestion Layer: Saving the Evidence
The first thing the pipeline does when it runs is save the raw API response to disk — before touching the database.
data/bronze/
└── ingestion_date=2026-05-15/
    └── earthquakes.json
Each file contains metadata alongside the records: ingestion_time, source_url, and record_count. This design decision is what makes the whole pipeline recoverable.
Why does that matter? Because BMKG only exposes the N most recent events at any given time. If I had a bug in my transformation logic and wrote directly into DuckDB, I might corrupt or lose data with no way to recover it. The bronze layer is immutable. It’s the audit trail. If something breaks downstream, I can replay the entire pipeline from the raw snapshots without touching the API again.
Once the JSON is safely stored, the ingestor loads it into DuckDB’s raw_earthquake table using an INSERT OR REPLACE strategy. The primary key for deduplication is a SHA-256 hash of the event’s core attributes — more on that choice later.
The Transformation Layer: dbt Does the Heavy Lifting
With raw data in DuckDB, dbt takes over in three stages.
Staging (stg_earthquake) is where the data gets cleaned up. Latitude and longitude are parsed out of the combined coordinate string. Magnitude is bucketed into categories. Depth is classified. Validation flags are added for records that look suspicious. Crucially, this model is incremental — it only processes new records since the last run, and it deduplicates using a ROW_NUMBER() window function over the event’s unique identifier.
Facts (fact_earthquake) is the final enriched table that analysts would query. It adds useful derived fields like event_date, event_hour, and a boolean is_major_earthquake flag for M≥7.0 events. This is the table that feeds dashboards and analysis.
Monitoring (earthquake_quality_summary) is the layer that most tutorials skip entirely. It’s a dbt model that runs after all transformations and produces a single row per pipeline run with a pipeline_status field: OK, WARNING, or FAILED. The logic checks three dimensions:
Dimension OK WARNING FAILED Data freshness < 2 hours 2–12 hours > 12 hours Major earthquake detected None M≥7.0 present — Invalid magnitude records 0 records Any found —
This is observability built directly into the data model. No external monitoring tool, no alerting service — just a SQL model that tells you whether today’s data is trustworthy.
5. Data Quality & Observability
The monitoring model is enforced at the CI/CD level. GitHub Actions runs the full pipeline every hour and checks the pipeline_status output before marking the run as passed or failed. If freshness exceeds 12 hours, the workflow exits with exit(1) — this is a hard failure that would surface as a broken badge in the repository, making data quality visible to anyone who looks at the repo.
WARNING status — triggered by a M≥7.0 detection or invalid records — doesn’t fail the CI run, but it’s recorded. This is intentional: a major earthquake is noteworthy, not broken. The pipeline should surface it loudly, not suppress it.
The test suite adds another layer. Python unit tests (tests/test_fetch_bmkg.py) cover 10 scenarios for the ingestion logic — network failures, malformed responses, partial API payloads. These run in a separate CI job before the pipeline job, acting as a gate. If the ingestor logic is broken, the pipeline never runs.
What I learned here: observability isn’t about dashboards. It’s about making the unhealthy state impossible to ignore.
6. Key Technical Decisions
These are the choices that aren’t obvious from the code, but that I thought hard about.
Why DuckDB instead of Postgres? BMKG earthquake data is medium-scale at most — thousands of records, not millions. Running a full Postgres server for this would be operational overhead with zero benefit. DuckDB gives full SQL with OLAP-grade analytical performance, runs in-process, and stores data in a single file. The clear upgrade path is either MotherDuck (managed DuckDB) or an Iceberg table on object storage if the scale ever demands it.
Why batch and not streaming? The BMKG endpoint is a polling endpoint, not an event stream. There’s no webhook, no Kafka topic, no change data capture — just a JSON file that changes over time. Streaming would add significant complexity for zero gain. An hourly batch run comfortably satisfies the SLA target of freshness under 2 hours.
Why SHA-256 and not MD5 for the surrogate key? MD5 is collision-prone. For a production pipeline where the key is used in deduplication logic and potentially foreign key joins, a collision would silently corrupt data. SHA-256 (truncated to 16 characters) gives collision-resistant uniqueness at minimal overhead.
Why the bronze layer at all? This is the one decision that paid off the fastest. Within two weeks of building the pipeline, I found a parsing bug in the coordinate extraction logic. Because every raw response was already saved to disk, I could fix the bug and replay the entire history through the updated stg_earthquake model. Without the bronze layer, that data would have been gone.
7. What the Data Tells Us
The pipeline is a means, not an end. Once clean, deduplicated facts are in DuckDB, the interesting questions become answerable.
Indonesia’s earthquake rhythm is relentless. The BMKG endpoint typically returns 15 events at a time. On most days, several of those are felt earthquakes (M≥3.0). Most are not close to populated areas, but the volume is a useful baseline.
Shallow earthquakes dominate. A significant portion of Indonesian seismic events are shallow-focus earthquakes (depth < 60km). These tend to be felt more strongly at the surface than deeper events of the same magnitude. The depth_category field in fact_earthquake makes this pattern immediately queryable.
Major events are rare but detectable. The M≥7.0 WARNING threshold in the monitoring layer is not academic. Indonesia has experienced several of these events historically, and the pipeline is designed to surface them with a non-failing alert the moment one appears in the data.
Freshness degradation is a real signal. In early testing, the pipeline surfaced a period where BMKG’s API wasn’t updating — the pipeline_status correctly moved to WARNING at 2 hours and would have escalated to FAILED at 12. That’s the monitoring layer working exactly as intended.
8. Lessons Learned
Immutability is underrated. The bronze layer felt like overhead when I was building it. It turned out to be the most valuable single decision in the entire architecture. Store the raw data. Always.
Build the unhealthy state first. I designed the FAILED and WARNING status before I designed the OK status. Knowing exactly what “broken” looks like made everything else easier to reason about.
Incremental models are not free. The first implementation of stg_earthquake had a subtle bug where records could be double-counted across runs if the unique key wasn’t airtight. The deduplication logic via ROW_NUMBER() was the fix, but it required thinking carefully about what “unique” actually means for a seismic event.
SHA-256 hash keys are worth the extra characters. I initially used a simpler composite key (event time + location string). It produced false uniqueness for events that were BMKG’s revised readings of the same earthquake. The hash over a stable set of attributes fixed this.
CI as a quality gate, not just a build check. Making the SLA threshold an actual workflow failure — not just a logged warning — changes how you think about data reliability. If the freshness check fails, the pipeline is broken. No ambiguity.
9. Future Improvements
The current v2 pipeline is stable and runs daily. Here’s what I’d explore next:
Parquet for the bronze layer. JSON is human-readable and great for debugging. At 10x the current volume, switching bronze storage to Parquet would reduce file size by roughly 10x and make backfill queries significantly faster.
MotherDuck or S3 + httpfs. The single-file DuckDB approach has a ceiling. At 100x scale, moving the warehouse to MotherDuck (managed, queryable from anywhere) or an Iceberg table on object storage would preserve the dbt transformation layer entirely while unlocking distributed querying.
Looker Studio dashboard. The facts table is ready to be visualized. A Looker Studio dashboard connected to a Google Sheets export of fact_earthquake would make the seismic activity visible to non-technical stakeholders — and serve as a portfolio piece that goes beyond “I built a pipeline.”
Anomaly detection on magnitude. The current monitoring flags static thresholds (M≥7.0, invalid records). A rolling statistical model — z-score or IQR-based — could detect unusual clustering of events in a region, which is seismologically more interesting than any single threshold.
Multi-source ingestion. BMKG isn’t the only earthquake data source in Southeast Asia. Extending the pipeline to ingest from USGS or regional agencies would enable cross-source validation and richer regional coverage.
Closing Thoughts
This project started as curiosity about Indonesia’s seismicity and ended up being a deep dive into what “production-ready” actually means for a data pipeline. The architecture isn’t flashy. No Spark, no Airflow, no cloud data warehouse. Just Python, DuckDB, dbt, and GitHub Actions — the smallest stack that handles the problem correctly.
What made it production-grade wasn’t the technology. It was the decisions underneath the technology: the bronze layer that makes data recoverable, the monitoring model that makes unhealthy states visible, the CI gate that makes quality non-negotiable.
If I had to give one piece of advice to someone building their first data pipeline: design for the failure state first. The happy path is easy. The interesting engineering happens when something goes wrong and you need to know exactly what, and why, and what data you can trust.
The full source code is available at github.com/billycemerson/earthquake-monitoring. Feedback and contributions are welcome.
Tags: #DataEngineering #dbt #DuckDB #Python #Indonesia #GitHub Actions #DataPipeline
I Built a Production Earthquake Monitoring Pipeline for Indonesia — Here’s What I Learned was originally published in Towards AI on Medium, where people are continuing the conversation by highlighting and responding to this story.