
I Built a Telegram Bot That Tells Me When My Stocks Are “Cheap” — Built on 50-Year-Old Math
Bollinger Bands, RSI, and a few hundred lines of Python — a walkthrough of building a personal market monitor.

Table of contents
- The problem
- TL;DR
- Why these four indicators, and not thirty others
- The architecture, in one diagram
- Setting it up (≈10 minutes)
- Living with the bot
- What a real alert looks like
- What this bot isn’t
- What I’d add next
- Why I built this for myself
- References
The problem
I open my brokerage app maybe twelve times a day. Most of those checks teach me nothing. The market hasn’t moved meaningfully since the last refresh, and even when it has, I shouldn’t be acting on a 0.3% intraday wiggle in an ETF I plan to hold for ten years.
So I built a bot that watches for me.
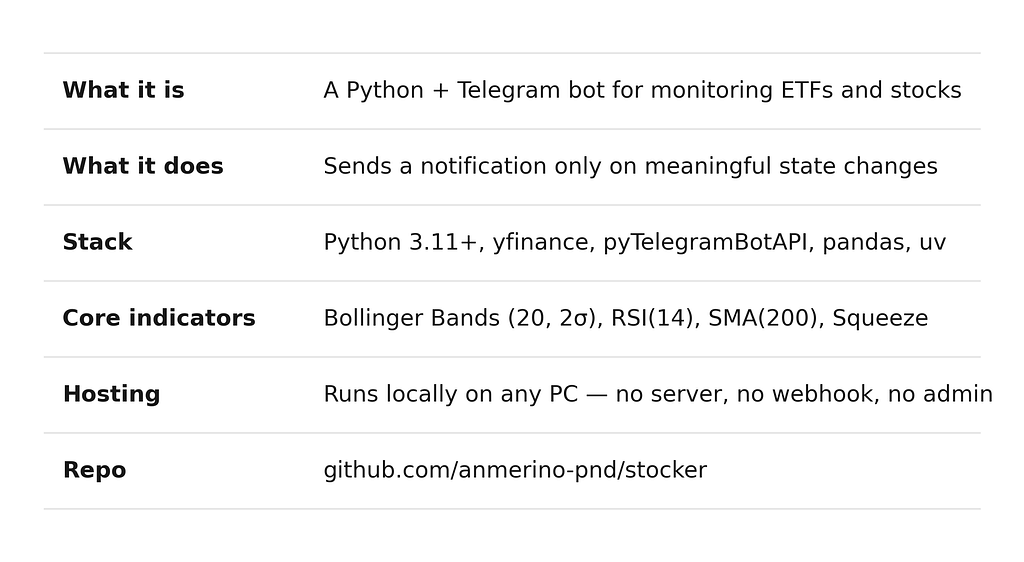
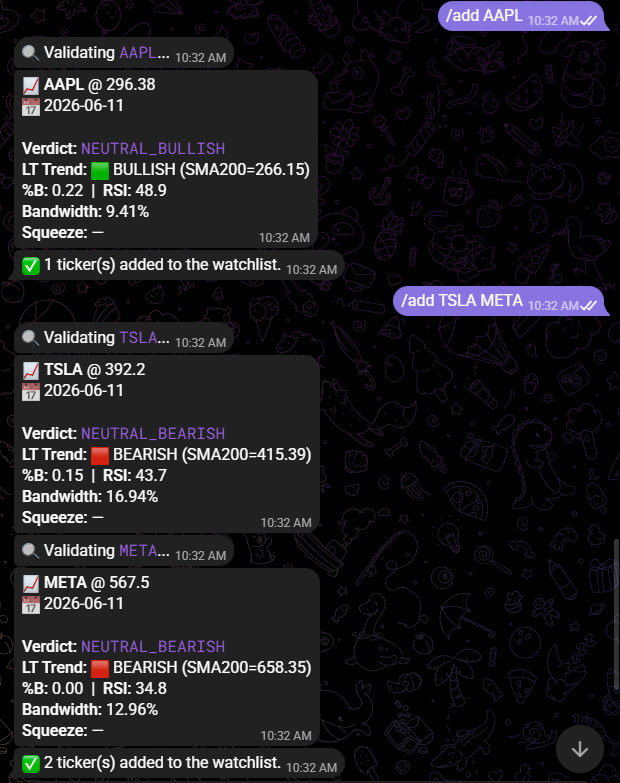
Stocker is a Telegram bot that monitors a watchlist of tickers, computes a small set of classic technical indicators (Bollinger Bands, RSI, a Bandwidth Squeeze detector, and an SMA-200 trend filter), and only buzzes my phone when something meaningful actually changes. Not when the price ticks up. Not when the bands shift by a hair. Only when the state of the asset changes in a way the technical-analysis literature considers actionable.
This article walks through how I built it, why I chose these specific indicators (the math is older than I am), and the architectural choices that come from running everything on a personal PC — no servers, no webhooks, no admin permissions. By the end, you’ll have a working bot watching your own tickers, and a clearer picture of why a 1978-vintage indicator still earns its place in 2026.
TL;DR
Why these four indicators, and not thirty others
Pop technical analysis is a swamp. Wander into r/StockMarket and you’ll find people drawing lines between random highs to predict reversals, or stacking seventeen indicators on a chart until anything looks “predictable” in hindsight.
I deliberately chose four indicators because each has a defensible academic origin and a clear, distinct job.
Bollinger Bands (John Bollinger, 1980s)
A 20-day simple moving average of closing prices, plus and minus two standard deviations. Under the (imperfect) assumption that returns are roughly normally distributed, ~95% of prices should sit inside the ±2σ envelope. When the price walks the upper band, it’s “expensive” relative to recent volatility. When it touches the lower, it’s “cheap.”
Why this and not something fancier? Because volatility is the right denominator for “expensive.” A $5 move means something different in Tesla than in a utility ETF. Bollinger Bands normalize for that automatically.
Relative Strength Index — RSI (J. Welles Wilder, 1978)
A momentum indicator that compares the magnitude of recent gains to recent losses, smoothed exponentially.
Conventional thresholds: below 30 = oversold, above 70 = overbought.
Why combined with Bollinger? Because each catches something the other misses. Bollinger asks “where is the price in its volatility envelope?” RSI asks “how strong is the move getting it there?” When both signal oversold simultaneously, the literature (Connors & Alvarez, Short Term Trading Strategies That Work) shows substantially higher historical reliability than either alone. In Stocker, this “double confirmation” is what separates a SOFT_BUY verdict from a STRONG_BUY.
SMA(200) trend filter (Mebane Faber, 2007)
This one isn’t a signal — it’s a veto. If the price is below its 200-day moving average, the long-term trend is bearish, and any short-term “oversold” reading could be just a falling knife. Faber’s 2007 paper showed that simply requiring price > SMA(200) before going long historically improved risk-adjusted returns on most major indices through multiple market cycles.
In Stocker, this filter neutralizes buy verdicts in downtrends. Bollinger says cheap + RSI says oversold + SMA(200) says downtrend → CAUTION, not BUY.
Squeeze detection (Bollinger, 2001)
When the Bandwidth — the relative gap between the upper and lower bands — compresses to a multi-month low, large moves often follow. Direction unknown, but something is brewing. Stocker flags this separately so you can pay closer attention to a ticker that’s about to wake up.
Four indicators. Three signals (Bollinger, RSI, Squeeze) and one filter (SMA200). Each is doing a specific job no other indicator in the set can do as well.
The architecture, in one diagram
Three moving parts, all running in a single Python process:
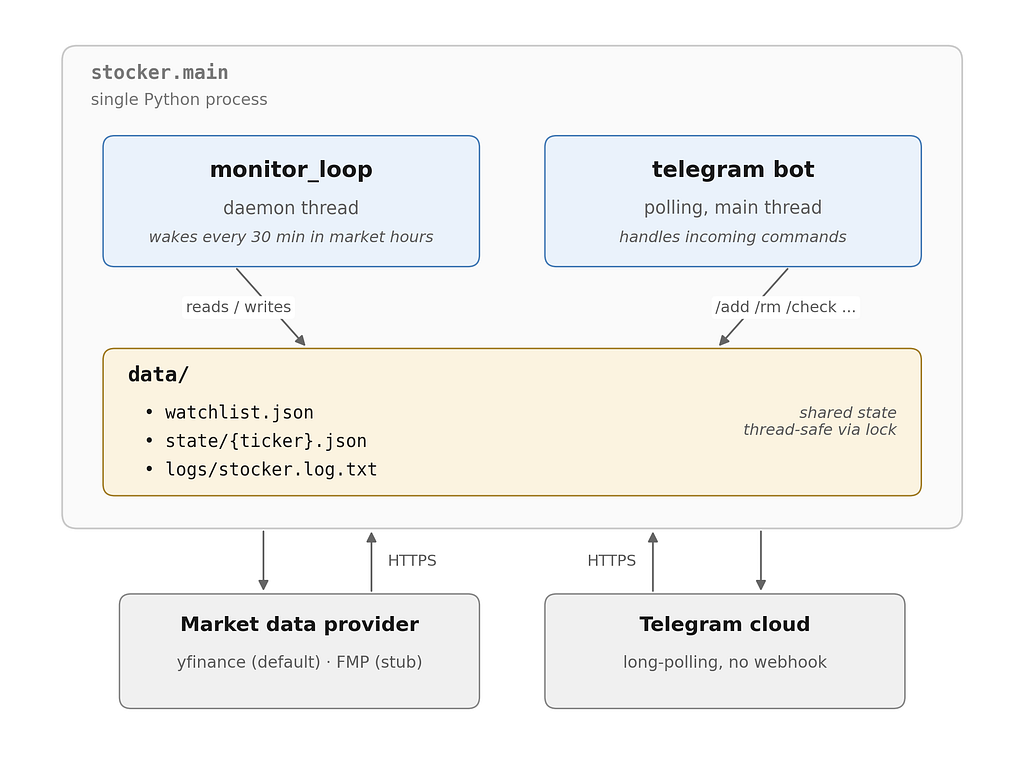
The monitor loop wakes up every 30 minutes during market hours, iterates the watchlist, downloads recent prices, recomputes indicators, and compares the new state to the last persisted one. Only on a real state change does it call the notifier — which is just a thin wrapper around bot.send_message.
The Telegram bot uses polling, not webhooks. No need for a public URL, ngrok tunnel, or open ports. The bot library (pyTelegramBotAPI) opens a long-polling HTTP connection to Telegram and keeps it alive — Telegram responds the instant a message arrives or after a timeout. The bot processes commands and writes to the same data directory the monitor reads from. A threading.Lock keeps the two from stepping on each other’s files.
Inside the data provider abstraction, the default is yfinance (free, no API key, ~15-minute delayed quotes). The codebase ships with a stubbed FMP provider so anyone who wants real-time data can drop in their API key and swap.
Setting it up (≈10 minutes)
1. Get a bot token from BotFather
Open Telegram, message @BotFather, send /newbot, follow the prompts. You’ll get an API token — treat it like a password, never paste it in chats or screenshots. (If you ever leak it: /revoke in BotFather kills it instantly.)
You also need your chat ID so the bot can authenticate it’s talking to you. Message @userinfobot to get yours.
2. Clone and install
git clone https://github.com/anmerino-pnd/stocker.git
cd stocker
uv sync
If you don’t have uv:
curl -LsSf https://astral.sh/uv/install.sh | sh
3. Configure .env
TELEGRAM_BOT_TOKEN="123456789:ABC..."
TELEGRAM_CHAT_ID="987654321"
DEFAULT_PROVIDER="yfinance"
MONITOR_INTERVAL_MIN="30"
4. Run
uv run python -m stocker.main
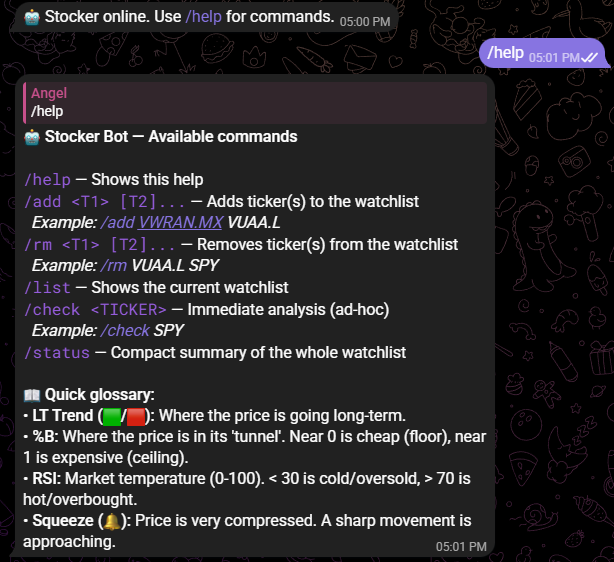
Your phone pings with “Stocker online. Use /help for commands.” Everything else happens through Telegram.
Living with the bot
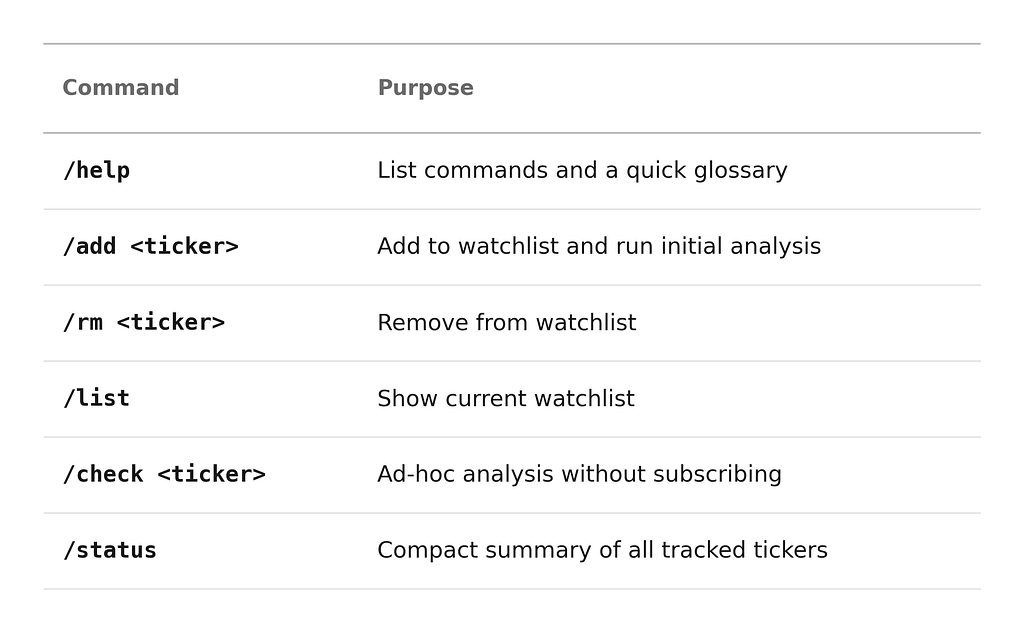
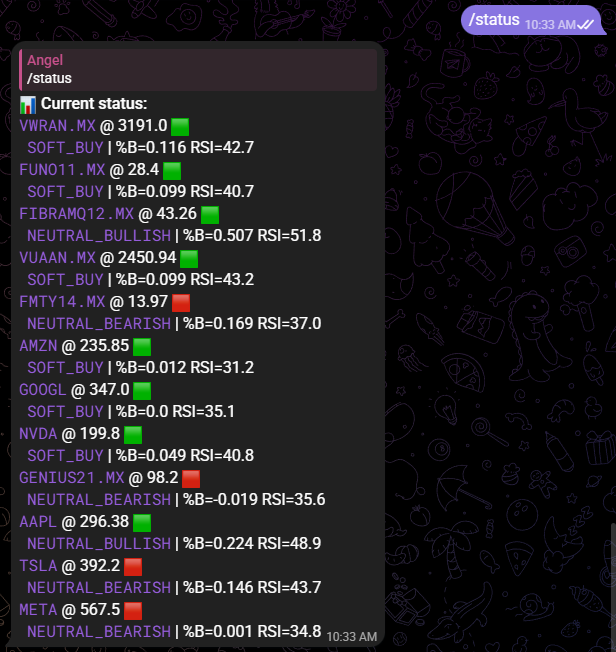
Six commands cover the entire interaction:
A typical week looks like:
- Monday morning: /status to see where everything stands.
- Tuesday through Friday: nothing — unless the bot pings me.
- When a ping arrives, that’s when I open the app.
What a real alert looks like
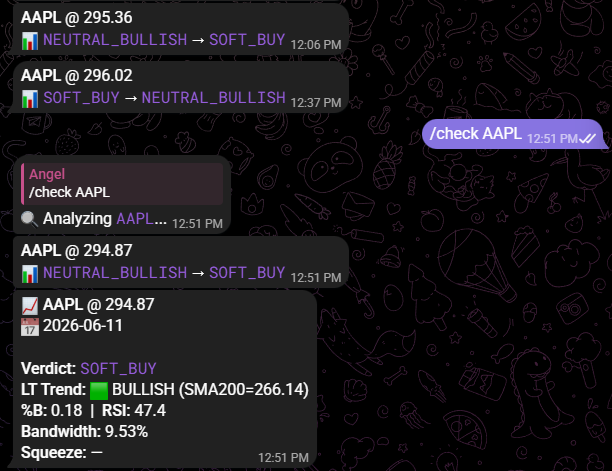
📊 VWRAN.MX: SOFT_WAIT → SOFT_BUY
@ 3,201.50 | %B=0.18 | RSI=33.4
🟩 Trend filter: BULLISH (price > SMA200)
FX-check: VWRAN -2.1% vs VWRA -2.0%
→ Real move in underlying, not just currency
The first line is the headline — what changed.
The second is the current state.
The third confirms the long-term trend filter is still green.
The fourth — only for MXN-listed global ETFs — tells me whether the move is in the underlying asset or just peso/dollar noise. (I added this after realizing my “discount day” on VWRAN was sometimes just MXN strengthening against USD.)
If the verdict is unchanged but the price drops at least 0.5% since the last check inside an already-favorable zone, the bot also fires an “opportunity dip” ping. Subtle pullbacks inside cheap zones are often where the actual best entries hide.
What this bot isn’t
This is important, and the FIRE-bro accounts on Twitter usually won’t tell you:
It’s not a money machine. Technical analysis has not been shown in rigorous academic studies (Fama, Bessembinder, Lo) to consistently beat buy-and-hold on broad equity indices over long horizons. What it can do is help deploy marginal capital with more discipline during corrections — that’s a real but modest edge.
It’s not for day trading. Daily-close indicators don’t say much intraday. The bot is designed for someone accumulating ETFs over years, not flipping positions in hours.
It doesn’t know about your portfolio. It won’t tell you “you already have too much VWRAN” or “your allocation is off.” It watches tickers and signals state changes. Position sizing is still your job.
It doesn’t read the news. If there’s a geopolitical event, you see it through the price reaction — not through context. The bot tells you that something happened, never why.
For my use case (accumulating broad-market ETFs over the next decade), this scope is exactly right. The bot’s job is to tell me when to look. Everything past that is still mine.
What I’d add next
If you fork this, the natural roadmap is:
- /history and /squeeze commands for richer ad-hoc queries.
- Full FMP provider — the stub is ready in the codebase with a defined Provider interface; it just needs implementation.
- Chart attachments — send a small PNG via send_photo alongside the alert.
- Daily digest — a single message at market close summarizing the whole watchlist, even when nothing fired.
- Position-aware alerts — tell the bot you bought 11 shares at $3,092 and have it frame future alerts in P&L terms.
- Backtesting — /backtest <ticker> [years] to evaluate how this exact ruleset would have performed historically against buy-and-hold.
The architecture was designed for these. The Provider abstraction, the per-indicator core modules, the state-per-ticker storage — none of those additions require touching foundations.
Why I built this for myself
The honest reason: I check my brokerage app too often, and that’s bad for me as a long-term investor. Every refresh is a tiny invitation to do something — anything — to feel in control. Most of those somethings would have been wrong.
A bot inverts that pattern. By delegating the watching, I get to keep the discipline of long-term investing while still being responsive when the market actually offers something. The bot doesn’t get scared. It doesn’t have FOMO. It doesn’t need to feel productive by clicking.
It watches. And when it texts me, I know it’s worth looking.
References
- Bollinger, John (2001). Bollinger on Bollinger Bands. McGraw-Hill.
- Wilder, J. Welles (1978). New Concepts in Technical Trading Systems. Trend Research.
- Faber, Mebane T. (2007). “A Quantitative Approach to Tactical Asset Allocation.” Journal of Wealth Management.
- Connors, Larry & Alvarez, Cesar (2009). Short Term Trading Strategies That Work.
- Murphy, John J. (1999). Technical Analysis of the Financial Markets. Prentice Hall.
If you build something like this for your own portfolio, I’d love to see what indicators you add. The repo is open — fork, modify, share.
I Built a Telegram Bot That Tells Me When My Stocks Are “Cheap” — Built on 50-Year-Old Math was originally published in Towards AI on Medium, where people are continuing the conversation by highlighting and responding to this story.