
The shape of a guitar pick
I saw a post on X that plotted the function
(log x)² + (log y)² = 1.
Of course the plot of
x² + y² = 1
is a circle, but I never thought what taking logs would do to the shape.
Here’s what the contours look like setting the right hand side equal to 1, 2, 3, …, 10.
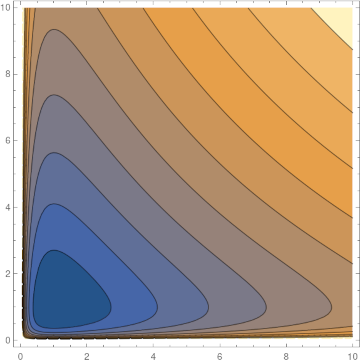
ContourPlot[Log[x]^2 + Log[y]^2, {x, 0, 10}, {y, 0, 10},
    Contours -> Range[10]]
The dark blue contour near the origin reminded me of a guitar pick, so I decided to take a stab at creating an equation for the shape of a guitar pick.
I wanted to rotate the image so the axis of symmetry for the pick is vertical, so I replaced x and y with x + y and x − y.
The aspect ratio was too wide, so I experimented with
log(y + kx)² + log(y − kx)² = r²
where increasing k increases the height-to-width ratio. After a little experimentation I settled on k = 1.5 and r = 1.
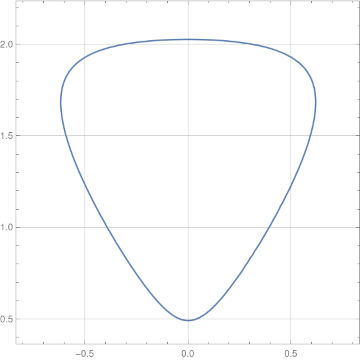
This has an aspect ratio of roughly 5:4, which is about what I measured from a photo of a guitar pick.
The post The shape of a guitar pick first appeared on John D. Cook.