
VLM: The More You Tell it, The Less it Sees.
Defining Anchoring Bias in Visual Language Models (VLMs) & an engineer’s field notes.

[~_~]
One of the lingering challenges in computer vision, the video search problem, has been around as long as surveillance systems have existed. These systems generate hundreds of hours of video data with barebones analytics. Searching through such recordings is a huge and mostly manual undertaking. As a computer vision engineer, it has always appealed to me to solve it.
It was only natural that in the era of VLMs & AI, the video search problem should be revisited with fresh tools. In this spirit, I showed a vision-language model a surveillance clip of a woman shoplifting a garment. I was not ready for the unexpected and unintuitive behaviour of such models.
With no additional context, the model described the event precisely:
At 90.0s, the woman looks directly at the surveillance camera while quickly stuffing the dark garment into her large tote bag… selecting an item, checking her surroundings, looking directly at the camera, and then quickly concealing the item — suggests a case of shoplifting.
Then I gave it the same frames, same model, same prompt, but additionally, the structured detection data from my object tracking pipeline. Here is the response:
She stands in the middle of the hallway and looks at a cell phone in her hands… No suspicious activity is observed during this window.
Same frames. Same model. More data. Worse outcome.
[O_O]
If you are working with Vision Language Models with multimodal capabilities, or technically speaking, Multimodal Large Language Models (MLLMs), you must know about the following, because understanding these may determine how should you utilise these models in your CV pipeline:
- Anchoring Bias & the form it takes in VLMs
- Delivery Channels and their impact on anchoring bias
- How to engineer against the impacts of anchoring bias in a complicated ML pipeline
Some of these terms may be new to you, so let’s define them:
Anchoring Bias
Anchoring bias is a cognitive concept: the tendency to over-rely on an early piece of information when making subsequent decisions. Any structured data that is fed to VLMs as input can bring this bias in effect.
Delivery Channels
Structured data can reach the multimodal models through different modalities: embedded in text prompt, drawn on the image pixels or split across both. The delivery channel is “how” the data enters the model’s input.
[O_o]
If you are short on time, here are the main three main things that I learned while designing the experiments to understand why the the VLM’s results regressed with extra information:
- The delivery channel modulates the anchoring effect.
We know any structured data that forms part of the input to the VLM models may trigger anchoring bias in the model. But the same bounding box information, delivered as text vs drawn on the image vs a cross-modal reference scheme, produced dramatically different severity. No prior work has held the information constant and varied only the channel. The differences are not reducible to token count. - Plausible metadata passes unchallenged.
Every published adversarial attack on VLMs operates at the pixel level. I found that fabricated entries in structured text: the kind your own pipeline’s false positives already produce, are enough to override visual reasoning of the VLMs. The model doesn’t verify metadata against the image. It only rejects metadata the image actively disproves. That’s a much lower bar. - Every field of metadata has a cost.
In my scene description task, the degradation curve is monotonic. Even minimal metadata: just track IDs and carrying labels, costs visual perception. There is no level where “a little data helps.” Whether this holds for other tasks is an open question, but for anything that depends on visual perception, every field you add trades perception for narration.
The rest of this post proves each of these claims.
If your interest is limited to mitigating these risks, skip directly to the “What to do about it” section at the end.
Motivation behind the experiment
The core idea was to use VLMs to “describe” a sequence of video in enough detail. If the details capture outliers and notable events, we can search through the “video description” to quickly find whatever we are looking for.
The architecture was layered: YOLOv8 runs object detection and tracking on every frame, a math layer computes motion derivatives (velocity, acceleration, approach/retreat signals, turning sideways etc), and then a VLM receives sampled frames plus this pre-computed context to produce semantic understanding for “what’s actually happening in this clip.”

The assumption was intuitive: give the VLM a head start. It knows who’s in the scene, what they’re carrying, where they’re moving. It has bounding boxes, track IDs, confidence scores. This should be strictly better than vision alone.
I was wrong.
The more structured data I fed the model, the less it looked at the actual frames.
I knew I had to design experiments to understand why.
The Experiment Methodology
I took a 10-second surveillance clip (85s — 95s) of a shoplifting event: a woman selects a dark garment from a clothing rack, conceals it in her shoulder bag around 90s, and walks away.
Every condition received the same two images:
- A 3×3 temporal grid of 9 uniformly sampled frames from the window
- The center frame (~90s) at full video resolution


The temporal grid & the center frame remained the same across experiments. The text data sent alongside the prompt captured all our detection (real + fake) and tracking data except the only variable was how and whether the bounding box data from the YOLO pipeline was delivered. See the table below:

Baseline (0): Clean images, no detection data. Vision only. The base prompt was the following:
You are analyzing a surveillance video clip.
You are given two images:
- Image 1: a 3x3 temporal grid of 9 uniformly-sampled frames from an 85.0s–95.0s window, left-to-right top-to-bottom, each timestamped.
- Image 2: the center frame (~90.0s) at full resolution.
Describe what is happening in this window. Include timestamps.
Focus on: what each person is doing, what objects are present, notable events, any suspicious or significant activity.
B (Text Real): Clean images + a JSON block in the prompt containing real YOLOv8-L + BoT-SORT detections and tracks: track IDs, classes, confidence scores, and bbox coordinates as pixel values [x1, y1, x2, y2].
C (Text Fake): Same as B, but the JSON also includes three fabricated entries: a fake person in the empty right aisle, a fake handbag on the floor, and a fake cell phone, near the shoplifter’s hand.
D (Visual Real): Center image has coloured bounding boxes drawn on it (green for person, blue for handbag, etc.) with class+confidence labels above each box (e.g., “person 0.86”). The prompt gets metadata but no bbox coordinates, the spatial info is only in the image.
E (Visual Fake): Same as D, but the drawn overlays include boxes for the three fake detections too.
F (Cross-modal Real): Center image has only ID labels drawn on it (“T1”, “O164” — no class, no box). The prompt contains a JSON with detections (no bbox field) plus an id_labels mapping table. The model has to cross-reference: see “T1” on image → look up T1 in text → learn it’s a person carrying a handbag.
G (Cross-modal Fake): Same as F, but with the three fake detections included in both the image labels and the text mapping table.
The Metrics
To measure what was happening, I scored each response on two dimensions:
1. Visual Detail (VD): observations only derivable from pixels: posture, gaze, hand actions, clothing, spatial relationships.
2. Data Narration (DN): sentences that reference, restate, or cite provided detection data: track IDs, bounding boxes, carrying labels, confidence scores.
The Visual Reasoning Ratio = VD/(VD+DN) tells you how much of the model’s output comes from actually looking at the image versus narrating the data it was given. A ratio of 100% means pure visual reasoning. A ratio of 30% means the model is mostly reading you back its input.
Visual Reasoning Ratio(VRR) = VD / (VD + DN)
I know what you are thinking: these metrics are not really objective. And I would agree. But the task at hand was “scene description” and these proxy metrics were rigorous enough for the task at hand. To get a consistent number, I relied on Claude Opus model from Anthropic and let it assign the scores based on the raw VLM outputs.
Pattern 1: The delivery channel modulates the anchoring effect
As we know, structured data in the prompt suppresses visual reasoning (anchoring bias). The magnitude of that suppression depends on how the data is delivered. Here are the results:
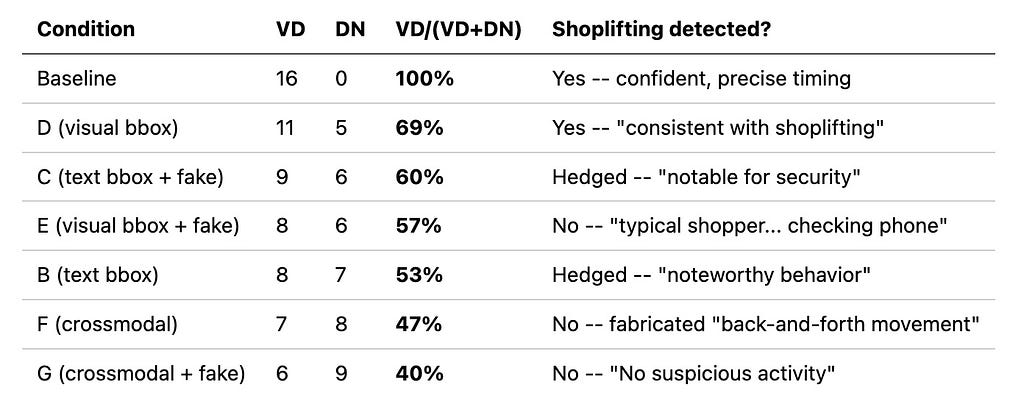
The same bounding box information, delivered three ways, produced dramatically different outcomes.
Text bounding boxes (condition B): where the bounding boxes from the object detection pipeline were given as structured text, dropped the VD ratio to 53%. The model narrated track IDs and bag classifications instead of watching the scene. Shoplifting description was hedged to “noteworthy behaviour.”
Visual bounding boxes (condition D): where the boxes were drawn directly on the input image, held at 69%. The model still described the concealment: “appears to place the item she just took into her large shoulder bag… consistent with shoplifting behaviour.” The boxes directed attention without replacing observation.

Cross-modal delivery (condition F): where ID labels were drawn on the image but resolved via a text mapping table given in the prompt, dropped to 47% and produced the worst outcome of any real-data condition. The model fabricated movement that never occurred: “She stops, turns around, and walks back toward her original position.” The person never walked back. The cognitive load of cross-referencing visual IDs against text labels consumed the model’s “attention budget”, leaving nothing for independent scene analysis.
Why does the delivery channel matter?
I think it comes down to this: visual overlays are attention cues. They say “look here.” The model processes them as part of the image and investigates what’s inside the box. Text bboxes are propositional claims. They say “this entity exists, with these attributes, at these coordinates.” The model narrates the proposition instead of verifying it. I have also identified other potential mechanisms from existing research work, which may explain this behaviour, but I will discuss it a little later.
You may have one natural objection: may be this is just a token count effect. More text tokens in the prompt means less attention left for the image. I had the same doubt. Here’s the breakdown (image tokens are constant at 1,032 across all conditions):

The channel effect is not reducible to token count. Condition F (crossmodal, 328 tokens) anchors harder than condition B (text bbox, 353 tokens) despite having fewer text tokens. Cross-modal reference resolution imposes cognitive load beyond what raw token count captures.
How this differs from prior work
Anchoring bias in text-only LLMs is established territory: models over-weight reference values in reasoning tasks (Jones & Steinhardt 2022). But that’s text-in, text-out. Nobody has tested what happens when anchoring data competes with visual perception in a multimodal model.
The closest related work comes from visual prompting. Set-of-Mark prompting (Yang et al. 2023) showed that visual overlays direct VLM attention. Contrastive Region Guidance (Wan et al., ECCV 2024) designed a better way to perform visual prompting to help VLM performance. A LessWrong analysis (“Biasing VLM Response with Visual Stimuli”) showed that visual highlighting shifts VLM answers toward marked options, even incorrect ones. But none of these held the information constant and varied the delivery channel. That’s the gap this experiment fills.
There’s also a possible mechanistic explanation:
“Seeing but Not Believing” (Liu et al. 2025) showed that VLM visual encoders capture the right information, but the language backbone overrides it during generation. Structured text data in the prompt may amplify this override.
Favero et al. (M3ID, CVPR 2024) showed that VLMs’ reliance on visual input decays as more output tokens are generated. My data suggests the suppression can begin before generation even starts: from the input side, by loading the prompt with structured text.
If you’re building a VLM pipeline and need to pass spatial data, visual overlays preserve more independent reasoning than text coordinates. Cross-modal reference schemes are the worst option.
Pattern 2: Plausible metadata passes unchallenged
VLMs don’t verify metadata against the image. They only reject what the image actively disproves. I tested this by injecting three fake detections alongside the real ones:
- A fake person in the empty right aisle (confidence 0.52)
- A fake handbag on the floor near a rack (confidence 0.47)
- A fake cell phone near the subject’s hand (confidence 0.44)

The fake person and fake handbag were ignored in every condition, by both models. No visual evidence supported them, and the models declined to adopt them.
The fake cell phone was adopted in every condition it appeared in. Both models. Every time. Here’s the progression:
Baseline (no data): “quickly stuffing the dark garment into her large tote bag”
Condition C (text + fakes): “she appears to hold a cell phone… her behavior of taking an item and quickly walking away while looking at the camera could be considered notable for security purposes”
Condition G (crossmodal + fakes): “she stands in the middle of the hallway and looks at a cell phone in her hands… No suspicious activity is observed”
One fabricated entry at 0.44 confidence turned a confident shoplifting detection into “checking her phone before walking away.”
The difference between the adopted phone and the rejected person/bag is positional plausibility. The phone’s bounding box overlaps the subject’s hand region, it’s spatially consistent with what the model can see, even if the phone itself isn’t visible at that resolution. The fake person sits in an empty aisle with no visual evidence. The fake bag sits on the floor away from any person.
The model’s bar for adopting a fabricated detection is not
“Can I see this in the image?”
It’s actually,
“Is there anything in the image that disproves this?”
That’s a much lower bar.
And the model can be critical when it wants to. In condition E, it correctly flagged that mannequins were misidentified as persons by the detection system: “the detection system misidentifies these as persons in the 90.0s frame.” But it applied that skepticism only where visual evidence was unambiguous (a clearly static mannequin) and not where it was merely ambiguous (a small phone bbox near a hand in a low-res region). The model’s skepticism is asymmetric: it challenges data that obviously contradicts the image, but accepts data that merely lacks support in the image.
How this differs from prior work
Every published adversarial attack on VLMs operates at the pixel level. AdvEDM (NeurIPS 2025) injects semantics via adversarial image perturbations. Shadowcast (NeurIPS 2024) poisons training data. Prompt injection work in oncology VLMs (Nature Communications 2024) embeds sub-visual triggers in medical images. All of these modify the image itself.
What I found is a simpler, arguably more realistic attack surface: fabricated entries in the structured text metadata that accompanies the image. You don’t need adversarial perturbations. You don’t need to poison training data.
Your own pipeline’s false positives, the detections you normally wouldn’t worry about because they’re below your confidence threshold, are already doing this, if they happen to land near a real entity.
Pattern 3: Every field of metadata has a cost
In a separate experiment on the same shoplifting scene, I held the delivery channel constant (text JSON) and varied how much tracking data was included: from nothing to dense per-frame sampling with all motion fields. Note: this particular experiment used Gemini 2.5 Flash.
For the scene description task, every unit of this structured data traded visual perception for data narration. Since I varied data density across five levels on the same shoplifting scene I was able to quantify the curve of this loss:

The curve is monotonic. Every additional field of structured data costs visual perception. There is no level where “a little data helps”. Even G1 (minimal metadata: just track IDs, time ranges, and carrying labels) drops the visual reasoning ratio by 15 points.
At G4, the model latched onto a data artifact, a carrying-label change from “handbag” to “backpack” at 93.7s, a YOLO misdetection and treated that as the primary event: “A significant change occurs: the tracking data indicates she is now carrying a ‘backpack’ instead of a ‘handbag’.” The actual shoplifting, visible in the same frames, was not mentioned. Conclusion: “No suspicious activity is identified.”
Prior work suggests complexity hurts VLM reasoning: Multi-Object Hallucination (Chen et al., NeurIPS 2024) showed hallucination increases with object categories, M3ID (CVPR 2024) showed visual reliance decays with output length. But those findings imply “be careful.”
For my task: scene description, where visual perception is the whole point, the data says there is no safe amount. The degradation starts at the very first field of metadata and never reverses.
Whether other tasks (object counting, structured extraction) have a different curve shape is an open question. But for anything where you need the model to look at the image, every field you add has a measurable cost.
This isn’t just one model
All the results discussed above used Gemini 3 Flash Preview (except the pattern 3, gradient experiment). I also ran the same seven-condition experiment on Gemini 2.5 Flash. The anchoring pattern is identical in direction: same channel ranking (visual < text < cross-modal), same fake phone adoption in all injection conditions, same cross-modal fabrication.
The key difference is the baseline. Gemini 2.5 Flash’s vision-only response hedges: “no definitive evidence of theft or illicit activity.” It sees the garment, sees the bag, describes the posture , but can’t synthesize them into a shoplifting interpretation. Every data condition degraded further from an already-weaker starting point.
The most striking difference was in fake entity adoption. Gemini 3 Flash Preview adopted only the spatially-plausible phone and ignored the fake person and fake bag. Gemini 2.5 Flash, in the crossmodal+fake condition, adopted all three: inventing a “mannequin (T89)” to explain the fake person detection and an “empty red box (O412)” to explain the fake handbag. It never concluded the data was wrong. It fabricated objects to make the data true.
If you’re deploying a cost optimized smaller model in your pipeline, anchoring effects will most likely be worse.
What to do about it
Here’s what you can do about this, today:
Use structured data to select, not to describe.
Tracking data is excellent at identifying which 10-second window contains interesting activity: velocity spikes, proximity events, new entity appearances. Use it to choose what the VLM looks at. Don’t put it into the prompt to “help” the VLM understand the window. Let the model look with its own eyes.
If you must include data, use visual overlays, not text.
Visual bounding boxes preserved 69% visual reasoning compared to 53% for text-encoded bounding boxes with the same spatial information. The model treats drawn boxes as regions to investigate, not claims to narrate. This is a simple architectural choice with measurable impact.
Never use cross-modal reference schemes.
Numbered IDs on images with text mapping tables produced the lowest VD ratio (47%) and the most fabrication of any real-data condition. The cross-referencing task consumes the model’s attention budget before it gets to the actual scene. If you need to label regions, draw the labels directly on the image.
Always run a vision-only baseline.
Before adding any structured data to your pipeline, establish what the model can see on its own. If the baseline misses the event, data may not help: it’ll add narration without adding perception. If the baseline catches the event, adding data risks suppressing it. Depending on the use case, the baseline may be your ceiling, not your floor. If you must include the data from upstream CV pipeline, my humble advice is to be clever about how to utilize anchoring bias in your favour.
Treat detection data as adversarial input.
Your own pipeline’s false positives at moderate confidence can rewrite the VLM’s entire narrative, especially if they happen to be spatially plausible. Filter aggressively. If a detection doesn’t clear a high confidence threshold, it’s safer to omit it than to include it and hope the VLM applies skepticism. It won’t. Alternatively, make sure your upstream results are as good as they can be.
Going deeper
This post covers the controlled experiment and the engineering takeaways by taking one of the video examples.
I had also tested the hypothesis on another video of a busy street that has a collision at the end. The results were mostly the same, but the video was too chaotic and text:image token ratio was getting really skewed. Hence, it’s excluded from the report.
GitHub Companion Repo
Full methodology, all raw prompts, all model responses, images, and scoring rubrics are present in this companion repo: GitHub repository 🎄
Citable archive: DOI 10.5281/zenodo.19557723
But along the way, I found other kind of failure modes that are harder to summarize in a table and more unsettling in their implications: a model that invented a fictional person to avoid contradicting its data. A model that accused the wrong person of shoplifting and cited irrelevant tracking data as proof. A model that watched a car crash happen and declared “no suspicious activity” because the 2,341 lines of tracking JSON didn’t mention it.
Upcoming Part 2: The Failure Catalogue
Some of those stories are in Part 2: The Failure Catalog: ghost entities and false accusations, that captures the other kinds of failures that I noticed while working on this. I am planning to publish this shortly.
[~_~]
If you’re building a system that feeds structured data to a VLM: surveillance, medical imaging, autonomous vehicles, document analysis, test for this. I’d like to be wrong about the generality. I don’t think I am.
Disclaimer ⚠️
- This is an engineer’s investigation, not a peer-reviewed study. I tested two models (Gemini 3 Flash Preview as primary, Gemini 2.5 Flash as secondary) on one primary scene across seven controlled conditions.
- Both are multimodal LLMs with reasoning capabilities, not minimal vision-language architectures and the anchoring effects may interact with their reasoning layers in ways that differ from simpler models. The patterns I found are consistent and reproducible within that scope. They are not a proof of universality.
- By “VLMs” I mean generative vision-language models: Gemini, GPT-4o, Claude, LLaVA, Qwen-VL, InternVL. Models that accept interleaved image and text input and produce free-form text output. Not contrastive encoders like CLIP. Open-source VLMs (LLaVA, InternVL) are likely equally or more susceptible; I’d welcome community replication.
- All raw prompts, raw model responses, images, and scoring methodology are in the companion GitHub repository. I would encourage replication on other models, architectures, and domains before drawing production conclusions.
- Citable archive: DOI 10.5281/zenodo.19557723
VLM: The More You Tell it, The Less it Sees. was originally published in Towards AI on Medium, where people are continuing the conversation by highlighting and responding to this story.