
Spreadsheet Logic Extraction — What It Takes, and How AI Compresses the Timeline
Part 3: Classifying nested formulas, decoding VBA orchestration, and governing a rule registry — before a single pipeline is written
This series is written for data architects, platform engineers, and technical leaders designing resilient data systems in regulated environments.
The Problem With Moving Fast
Today, an LLM can parse a fifteen-level nested IF chain in seconds. It will annotate the branches, flag the hardcoded constants, and produce a pseudocode equivalent before you’ve finished reading the formula yourself. That changes the timeline of what this article describes. It does not change the sequence.
After locking in the platform direction — a layered Lakehouse on Databricks — the instinct was to start building. Infrastructure decisions were made. The architectural model was clear. The team wanted to move.
We didn’t move.
The reason was straightforward: we had no idea what the logic actually was. Not in any form that could be reliably translated. The spreadsheets contained years of accumulated transformation rules, workarounds, and regulatory adjustments embedded in formulas, macros, and the heads of the analysts who built them. Migrating to a modern platform without first extracting and validating that logic doesn’t solve the problem — it just relocates the fragility into more expensive infrastructure.
The extraction phase had to come first. What follows is what that phase actually involves — where AI compresses the work significantly, and where it still cannot replace the judgment a regulated environment demands.
Starting With an Inventory, Not a Migration Plan
The first practical problem: no one had a complete list of what was in scope.
Stakeholders described the landscape as “a few Excel files used for risk and claims reporting.” What we found was forty-three workbooks with meaningful transformation logic, not counting archived versions or duplicated copies living in personal OneDrive folders.
We audited each workbook across four dimensions before touching a single pipeline:
Purpose — Ingestion, transformation, aggregation, or reporting? Many workbooks did all four simultaneously, which was itself a structural problem worth documenting. Classifying purpose forced the first architectural decision: where does each piece of logic belong in the target layered model?
Connectivity — Which files referenced other files? External links between workbooks had created implicit dependency chains. We traced them manually, because there was no tooling that could reliably resolve cross-workbook references across a shared drive with inconsistent naming conventions. The resulting dependency graph exposed several circular reference patterns that analysts had been resolving by manually breaking and re-establishing links during refresh cycles.
Figure 5: Workbook dependency graph — implicit data pipelines across multiple workbooks, with one circular dependency flagged between UW_Calc and CAT_Adj.
Logic Density — How much actual transformation logic lived here, versus structural scaffolding? Some workbooks were essentially pass-through files. Others contained stacks of nested formulas encoding complex underwriting calculations that had never been formally documented anywhere.
Criticality — Which outputs fed regulated reports or downstream systems? This determined sequencing. High-criticality logic wouldn’t move until pipeline equivalence was validated against historical outputs. Lower-criticality workbooks gave us space to develop and test the migration pattern before applying it to files that mattered.
The inventory itself took two weeks. That was two weeks of effort that many teams skip, and it directly shaped every sequencing decision that followed.
Classifying the Logic — And Why It Matters for Migration Strategy
Not all spreadsheet logic translates the same way. One of the first practical mistakes teams make is treating all formula logic as equivalent and writing generic extraction scripts. The logic types have fundamentally different migration complexity, and conflating them produces pipelines that look right but behave incorrectly under certain input conditions.
Deterministic calculations were the most tractable. A loss ratio formula given defined inputs produces a defined output. These translated cleanly into SQL expressions or Python functions and could be unit-tested against historical data with high confidence.
=SUMPRODUCT(B2:B100, C2:C100) / SUM(B2:B100)
Both inputs are known columns in a defined dataset. The transformation becomes SUM(exposure * loss_factor) / SUM(exposure) in SQL. Historical data provides ready-made unit test pairs. Migration here is mechanical.
Conditional branching logic was more involved. Insurance underwriting and claims workflows contained deeply nested IF chains — some fifteen to twenty levels deep — encoding decision trees that had grown incrementally over years. The challenge wasn’t reading the formula. It was determining whether each branch was intentional business logic, a regulatory edge case, or a historical workaround that no longer applied.
=IF(D5>0.65, IF(E5="CAT_A", D5*1.12, IF(E5="CAT_B", D5*1.08, D5*1.04)), IF(D5>0.45, D5*0.96, 0))
The intent is readable — tier multipliers applied based on loss ratio thresholds and category codes. The problem is the 1.04 branch. Is that a current underwriting rate, or a value added in 2021 for a portfolio sub-segment that was discontinued in 2022? Without that context, a faithful translation embeds the wrong number into production.
Temporal and state-dependent logic was the hardest category. Several calculations depended on prior-period values, running accumulators, or refresh sequences managed by VBA.
=IF(B12="", PRIOR_PERIOD_VAL, B12 * ADJ_FACTOR)
In a stateless pipeline, PRIOR_PERIOD_VAL has to come from somewhere explicit — a snapshot table, a windowed aggregation, or a seed value loaded at run start. The formula just assumes it exists. Translating this pattern means making that dependency a first-class design decision: what is the state, where does it live, and how does it get populated before this transformation executes?
Reference data lookups were common and frequently invisible. Calculation logic routinely pulled from lookup tables embedded in hidden worksheets — rate tables, tier mappings, regulatory factor sets. They weren’t documented as reference data. They were just ranges with names like TBL_ADJ_FACTOR_2019.
=VLOOKUP(A5, TBL_ADJ_FACTOR_2019, 3, FALSE)
TBL_ADJ_FACTOR_2019 was a named range on a hidden sheet with 47 rows of rate factors. It hadn’t been “2019” since 2021 — the name was never updated. It needed to become a versioned, managed reference table in the Lakehouse with a defined update cadence, not a silently stale constant embedded in a spreadsheet.

The VBA Problem
VBA macros were described early in the project as “just automation scripts.” That framing underestimated the problem significantly.
In several workbooks, macros were not automating simple tasks. They were implementing the execution order of the transformation pipeline itself. The sequence mattered. A recalculate on Sheet 3 before Sheet 2 had completed its refresh produced incorrect intermediate values. The macro encoded that dependency — not as documented logic, but as procedural execution order.
Reading the VBA meant reading it carefully. We encountered:
- Conditional refresh logic that skipped specific sheets based on parameter values set in a control tab
- Error-handling blocks that suppressed failures silently and allowed execution to continue — meaning a broken external link would not surface as an error; it would just leave a stale value in place
- Range copy-paste operations that moved values between sheets as a substitute for proper data modeling — effectively implementing a manual staging layer inside the workbook
- Hardcoded file paths referencing network shares that no longer existed, bypassed by commented-out code and manually maintained substitutions
Each of these patterns had a direct architectural equivalent in the target platform. Conditional refresh logic becomes pipeline branching. Silent error suppression becomes a monitoring and alerting requirement. Range copy-paste becomes an explicit staged dataset. But the translation required understanding what the VBA was doing, not just what it was supposed to do.
The delta between those two things was non-trivial.
When the Logic Existed Nowhere Except Inside the File
A recurring practical problem was logic that had no external documentation — no requirements document, no design spec, no ticket. The formula was the only artifact. And in several cases, the analyst who wrote it had left the organization.
The response to this isn’t a knowledge-transfer meeting. It’s a forensic process.
We started by identifying every hardcoded constant in the workbooks — values embedded directly in formulas rather than referenced from a cell or table. Each one had to be classified: Is this a regulatory threshold? A business assumption? A temporary placeholder that became permanent? A value that should be parameterized?
Some were obvious. A 0.65 loss development factor referenced in multiple places was eventually confirmed as a regulatory capital floor. Some were not obvious. A multiplier of 1.0375 in a claims severity adjustment had no label, no comment, and no one who could immediately explain it. It took two days of cross-referencing rate filings before it was identified as a historical inflation adjustment applied once and never removed.
That kind of discovery is routine in spreadsheet migrations. The only mitigation is systematic enumeration — find every unexplained constant, document it, and resolve it before writing pipeline code.
How AI Changes This Work Today
The forensic process described above — tracing a 1.0375 multiplier across rate filings for two days, enumerating constants one by one, manually reading VBA line by line — was the reality of this engagement. If I were scoping the same project today, the calendar changes significantly. The architectural judgment required does not.
Here is what AI handles well, and where it still breaks.
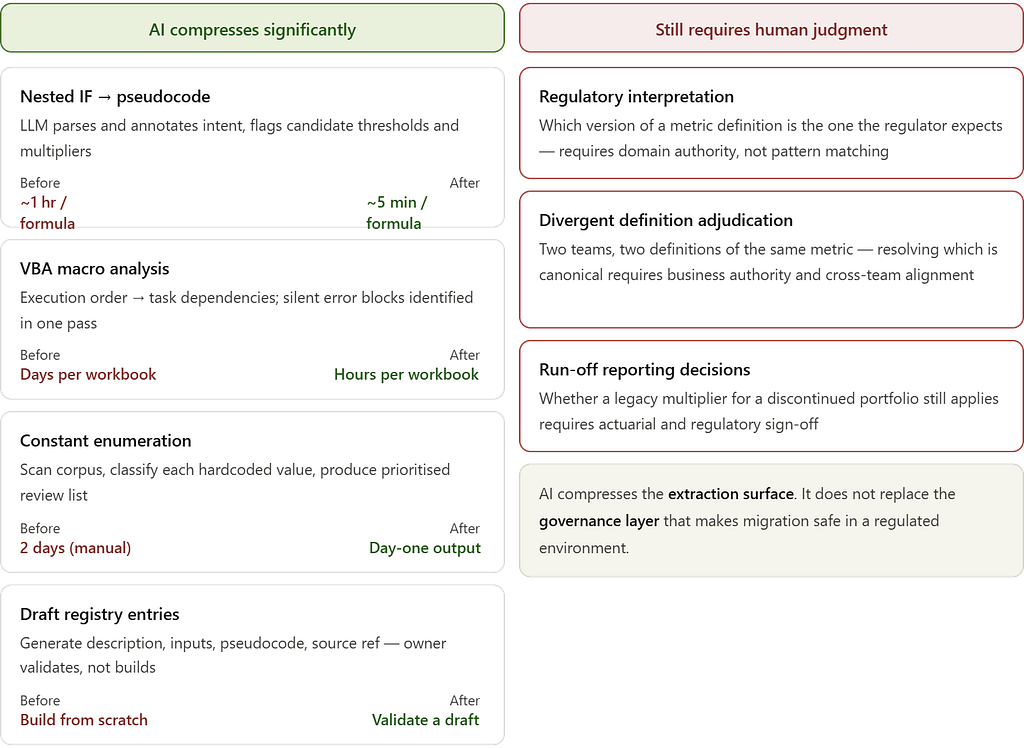
Translating nested IF logic into readable pseudocode is where LLMs are immediately useful. A fifteen-level nested IF that takes an experienced engineer an hour to parse can be fed directly to a model and returned as a structured decision tree in seconds. More importantly, the model will annotate likely intent — flagging where a branch looks like a regulatory threshold versus a hardcoded workaround. That annotation is a starting point, not a conclusion. Every flag still needs a domain owner to confirm it. But arriving at that conversation with a structured draft instead of a raw formula collapses the prep time substantially.
Prompt: "Explain what this Excel formula does.
Identify each branch condition, its output, and flag any hardcoded
values that may represent business rules or regulatory thresholds."
Formula: =IF(D5>0.65,IF(E5="CAT_A",D5*1.12,
          IF(E5="CAT_B",D5*1.08,D5*1.04)),
          IF(D5>0.45,D5*0.96,0))
What comes back is a structured breakdown of each branch, a plain-language description of what the formula is doing, and a list of the four multipliers flagged as candidate business rules. Two days of manual tracing compresses into a thirty-minute validation session.
VBA macro analysis is similarly strong. Paste a macro block, ask the model to describe the execution sequence as a set of ordered task dependencies, and ask it to flag any error-handling patterns that suppress failures silently. It will identify On Error Resume Next blocks, describe what they are protecting against, and explain the downstream risk. This is mechanical work that consumed significant engineering time during the audit. A model does it in one pass.
Hardcoded constant enumeration at scale is where the time savings compound. Manually scanning forty-three workbooks for unexplained numeric constants is a days-long effort. With a script that dumps cell values and formula text into structured output, a model can scan the entire corpus, flag every constant that appears to be a rate factor, regulatory threshold, or business multiplier, and generate a prioritised list for human review. The 1.0375 inflation multiplier would have appeared in that list on day one.
Draft rule registry entries can be generated directly from the formula, the pseudocode translation, and any workbook metadata available. Given a formula, a sheet name, and column headers, a model will produce a registry entry — description, inputs, logic, candidate source reference — ready for a domain owner to validate rather than build from scratch. That shift from construction to validation is the real time saving.
The prompt-based extraction described above is only the entry point. The same patterns extend further — automated corpus scanning across entire workbook ecosystems using API-based pipelines, AI-assisted code generation that translates registry specs directly into PySpark or dbt transformations, LLM-powered lineage inference tools that surface data flow visually, and documentation generation that auto-produces data dictionaries from pipeline code. These are all in active use today and each warrants a dedicated treatment. What matters here is that the extraction surface has fundamentally changed — the ceiling on what a small engineering team can cover in a given sprint is no longer set by how fast humans can read formulas.
Where AI does not help: The model cannot tell you which of two divergent loss ratio definitions is the one your regulator expects. It cannot determine whether a discontinued portfolio sub-segment still needs its legacy multiplier maintained for run-off reporting. It cannot resolve an ownership dispute between two actuarial teams about whose calculation is canonical. These decisions require regulatory context, business authority, and institutional knowledge that exists outside any prompt.
The rule registry still needs owners. The divergent logic still needs adjudication. The AI compresses the extraction surface; it does not replace the governance layer that makes migration safe in a regulated environment.
Establishing a Rule Registry
As extracted logic accumulated, we formalized it into a rule registry — a structured catalog that served as the authoritative specification for all transformation logic prior to implementation.
Each entry captured:
- Rule identifier and description — intent expressed in plain language, not formula syntax
- Input fields — exact columns, tables, or datasets, mapped to source systems
- Transformation logic — expressed in pseudocode or SQL; never in Excel notation
- Business owner — the domain expert who validated the rule’s correctness
- Source reference — workbook name, sheet, and cell range from which the rule was extracted
- Test cases — known input/output pairs drawn from historical data, used to validate pipeline equivalence post-migration
Here is what a validated entry actually looked like. The formula behind RR-047 was a nested IF referencing a catastrophe adjustment factor — one of the conditional branching examples above. By the time it reached the registry, the cell formula was gone. What remained was a specification an engineer could implement without opening the workbook:
Rule ID:     RR-047
Description: Gross loss ratio — property portfolio (catastrophe-adjusted)
Inputs:      gross_earned_premium, gross_paid_losses, cat_adj_factor
Logic:       IF cat_adj_factor IS NULL:
               RETURN gross_paid_losses / gross_earned_premium
             ELSE:
               RETURN (gross_paid_losses × cat_adj_factor) / gross_earned_premium
Owner:       Actuarial — Senior Underwriter (validated 2024-11-14)
Source:      loss_ratio_Q3.xlsx › Sheet: Calc_Core › Range: D14:D220
Tests:       3 input/output pairs from Q3 2023 actuals
Status:      VALIDATED
The registry had two functions. First, it created a governed artifact representing logic that had previously existed only inside files — directly relevant for regulatory audit scenarios. Second, it gave the engineering team a validated specification before implementation began.
This distinction matters. Without a rule registry, engineers translate formulas as they find them. That process produces pipelines that are structurally equivalent to the spreadsheets — which means they also inherit the same ambiguities and undocumented assumptions.
Resolving Divergent Logic
Part 1 of this series described two quarterly loss ratio reports for the same portfolio that produced different figures. That was the symptom. The cause was that the same metric had been defined independently in multiple workbooks, and the definitions had drifted.
The rule registry forced resolution. When two workbooks defined the same calculation differently, neither version could be migrated until the correct version was determined and formally owned.
These resolution decisions are architectural — not just analytical. Each one requires identifying which version reflects the current regulatory interpretation, which reflects an outdated workaround, and whether a third canonical version needs to be defined from scratch. In some cases, what looked like a discrepancy was actually two legitimately different calculations that had been incorrectly assumed to be equivalent. Separating them required new naming conventions, new metric definitions, and alignment across business units.
This is the work that doesn’t appear in most migration project plans. It’s also the work that determines whether the new platform is actually more reliable than what it replaced.
From Logic Extraction to Pipeline Specification
By the end of this phase, the forty-three workbooks had been mapped, classified, and decomposed. The VBA execution dependencies were documented as explicit pipeline requirements. The hardcoded constants were resolved and catalogued. The divergent metric definitions had been reviewed, adjudicated, and formalized.
Each rule in the registry mapped to a specific layer in the target Lakehouse model. Cleansing and domain standardization logic belonged in the curated layer. Business metric computations belonged in the analytics layer, built on top of governed, validated inputs.
The transformation logic was no longer implicit. It was specified, owner-attributed, and ready to be implemented as version-controlled pipeline code. The inventory was complete. The logic was extracted. The rule registry was validated.
We were ready to build — and for the first time, we knew exactly what we were building.
Next in the series: Building the Lakehouse Foundation — Medallion Design and Ingestion Pipelines on Databricks
Spreadsheet Logic Extraction — What It Takes, and How AI Compresses the Timeline was originally published in Towards AI on Medium, where people are continuing the conversation by highlighting and responding to this story.