
Using a Knowledge Graph to Generate Predictive Models for the Oscars

A layered semantic data foundation for agent-driven forecasting
Git Repo: https://github.com/SteveHedden/fckg
The full ontology, data pipelines, and modeling code are available in the repository.
Using AI to predict the Oscars is easy. Building the infrastructure that lets anyone (human or agent) produce forecasts is harder.
This post is not about a single model that forecasts winners. It’s about constructing a reusable semantic data foundation that makes prediction, analysis, and reasoning straightforward. The Oscars are simply a case study: a structured domain with clear outcomes and rich metadata. The real goal is architectural: to demonstrate how a layered knowledge graph enables modeling, question answering, and agent-driven experimentation in a reproducible way. This infrastructure can serve as a blueprint for other domains that may be, dare I say, more impactful than the Oscars 😲.
The idea is simple: build a data foundation such that anyone can ask:
- “Can you build me a model to predict the Oscars? I think X, Y, and Z are important features.”
- “Can you show me all nominees who won both a SAG and a BAFTA before winning an Oscar?”
- “Which precursor awards are most predictive?”
- “How many films that do not pass the Bechdel test have won the Best Picture Oscar?”
These questions do not require rewriting data pipelines, but a well-structured data foundation. That data foundation is a knowledge graph.
Overall architecture
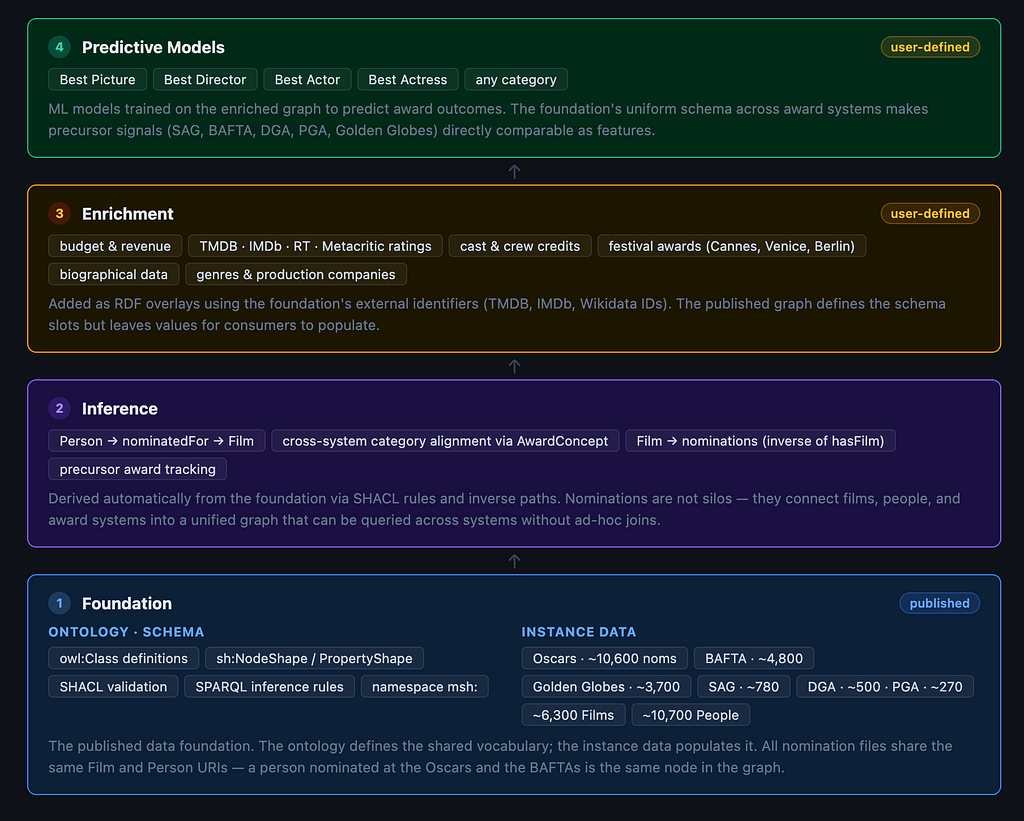
The image below shows the overall architecture. At the base is the data foundation: a formal ontology combined with instance data. Together, this creates a core knowledge graph — a structured representation of the domain that can support different analytical use cases.
The layer above the foundation is inference. Once we have the ontology and instance data together, additional relationships can be derived automatically. The graph becomes richer without manually adding any new data, but just because of the structure we have defined in the foundation.
The enrichment step is on top of that. Each film in the data foundation has multiple external identifiers associated with it: The Movie Database (TMDB); IMDb; and Wikidata. These IDs act as expansion points. Depending on the question being asked, users can retrieve additional data via APIs (revenue, ratings, cast and crew, genres, or anything else deemed relevant). The graph grows dynamically depending on what the user wants to explore or build.
Finally, the enriched graph supports predictive modeling. Features are extracted, models are trained, and predictions are recorded back into the graph, ensuring accountability, reproducibility, and traceability.
🧠 Layer one: the data foundation
The foundation consists of two complementary components: the ontology and the instance data. In previous posts, I’ve explored how the medical field has used knowledge graphs to manage complex information and advance clinical research and patient care. A major reason this approach works is the disciplined separation between structure and content.
The ontology defines the theory of the domain: what exists and how those entities relate to one another. The controlled vocabularies populate that structure with real-world entities: drugs, diseases, pathogens, and genes, to name a few.
Here is an example of what that looks like in medicine:

For the Oscars, our ontology needs to define things like movies, nominees, and nominations. This is what our movie ontology looks like:
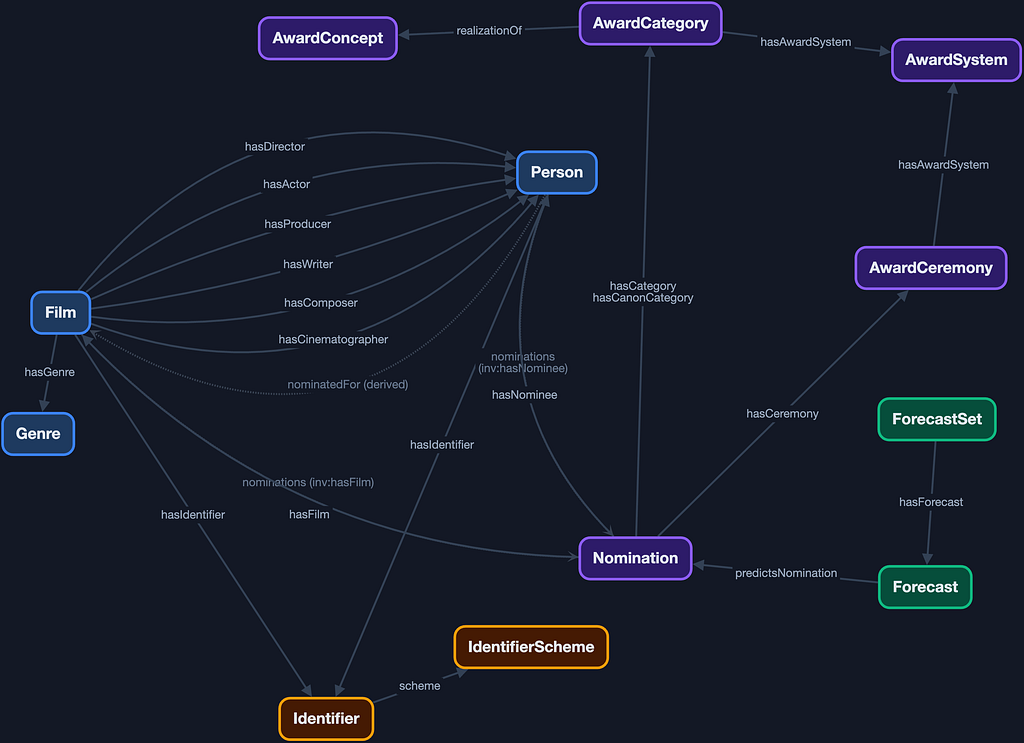
The primary goal of this knowledge graph is to support prediction. More specifically, to create models to predict who will win an Academy Award in any given category. The key class in the ontology, therefore, is nomination.
For each category at each ceremony, there is a set of nominations, and exactly one of them results in a win. A nomination is associated with:
- A film
- One or more nominees (people)
- A specific award ceremony (e.g., the 98th Academy Awards)
- An award system (Academy Awards, BAFTAs, Golden Globes, SAG, PGA, DGA)
- A category (Best Director, Best Editing, etc.)
Since different award systems use different categories, for the purposes of this knowledge graph, I have created the class Award Concept to enable cross-system alignment. For example:
- “Best Actor in a Leading Role” (Oscars)
- “Outstanding Performance by a Male Actor in a Leading Role” (SAG)
These are, in this ontology, both realizations of the same award concept. I learned that this is crucial because one of the best predictors of whether a nomination results in a win are precursor award ceremonies. The Oscars tend to be the last award ceremony so we want to ensure we are taking into account who won at the Golden Globes, the BAFTAs, the SAG awards, the Producers Guild of America (PGA) Awards and the Directors Guild of America (DGA) awards.
Since we are using this to create predictions, we also want to store those predictions in our graph, along with others we can find to calibrate. For any nomination we can have many forecasts, which we organize into forecast sets. Each forecast set records:
- The model used
- The feature set
- The date generated
- The individual probabilities assigned to each nominee
Each film also has identifiers associated with it. For this graph, so far, I have incorporated IMDb ids, TMDB ids, and Wikidata ids. These are a crucial piece of metadata because they are the way this data foundation can become a much larger graph that can be used to generate predictive models. This schema defines properties for revenue, budget, and ratings, but there are no values for them. But using these ids, and information about what the ids can be used for (accessing APIs), an agent can retrieve that data.
Instance data
The ontology defines the classes, relationships, properties, and key constraints. The instance data is how we populate the ontology to create a graph.
The key piece of instance data are the Oscar nominations themselves. I found this awesome dataset from David Lu which has many Oscar nominations going back to 1927. It was a csv so I converted to RDF and aligned it with our ontology.
What does it mean that the instance data is aligned with our ontology? Here is what the instance of the nomination for the movie Sinners for best. picture actually looks like in RDF format:

The top line says that:
Nomination_oscars_2026_best_picture_sinners_c477fbb973cc84ff
is an instance of Nomination. That is its unique ID, or Universal Resource Identifier (URI). Its structure encodes meaningful components:
- type: nomination
- award system: oscars
- year: 2026
- category: best picture
- film: sinners
The reason there is a bunch of random letters and numbers at the end, by the way, is just in case there are two movies with the same name nominated for the same category in the same year at the same award system. Unlikely, but possible. Remember the year everyone made a Pinocchio movie?
Each additional line associated with that URI is a triple: subject, predicate, object.
- The nomination (subject) has category (predicate) best picture (object).
- The nomination (subject) has nominee (predicate) Ryan Coogler (object).
Ryan Coogler is itself an instance of a person who has his own URI (Person_Ryan_Coogler). Because the same URI is reused everywhere he appears, all his nominations, films, and relationships become automatically connected.
What’s cool about storing data this way is that we basically just have a long list of nominations, a long list of people, and a long list of movies, but as long as we have an ontology to align them and URIs defined clearly they become an interconnected graph without any additional effort.
Structure + identifiers = connectivity.
This initial data foundation has a total of 366,784 triples and is about 17MB in size.
🔁 Layer two: inferences
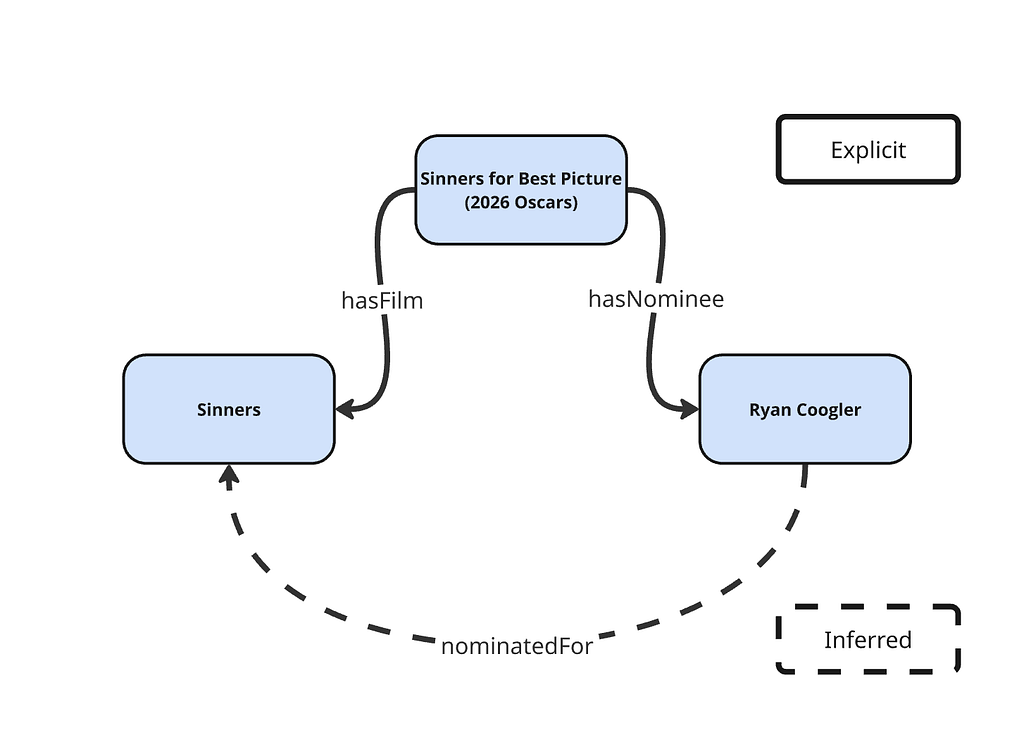
When the ontology and the instance data are combined, the graph becomes more than a collection of facts: it becomes a system that can derive new ones. These derived facts are inferences: triples that were not explicitly written, but are logically implied by the structure of the model.
For example, here is how Ryan Coogler appears in the instance data:

He simply appears as a Person. There is no information about his movies or nominations. Similarly, here is how Sinners appears in the data:

There is no information about what people were involved in making the movie or what it was nominated for. But the nomination told us that:
- The nomination “2026 Best Picture — Sinners”
- has nominee > Ryan Coogler
And in the ontology, we defined:
- hasNominee as the inverse of hasNomination
This means that the data explicitly tells us that the “2026 Best Picture Sinners” nomination has nominee Ryan Coogler, and the ontology tells us that the relationship has nominee is an inverse of has nomination, therefore, we can infer that:
- Ryan Coogler has nomination “2026 Best Picture Sinners”.
- Sinners has nomination “2026 Best Picture Sinners”.
We never store those triples/facts explicitly — they emerge from the structure.
This is what makes the foundation powerful. We define classes (Nomination, Film, Person, Ceremony), populate them with instances, and let the ontology connect them. These separate lists of instances become a coherent, interconnected graph.
These lists of instances, by the way, go by many names: glossaries, taxonomies, reference data, thesaurus probably — I generally just use the generic term “controlled vocabularies”. The label matters less than the discipline. What matters is keeping a clean separation between:
- The ontology (structure of meaning)
- The instances (the populated entities)
After reasoning is applied, the graph expands from 366,784 to 522,503 triples (about 23MB). Those additional data are facts that we don’t need to store explicitly 😎.
🌍 Layer three: Enrichment
The final structural component of the foundation is metadata — specifically, external identifiers that link the graph to other datasets.
Every film in the graph is associated with IMDB, TMDB, and Wikidata IDs. These identifiers act as expansion points. They allow users (or agents) to retrieve additional attributes dynamically, depending on the modeling goal.
Be careful, this is how you can create a MASSIVE graph. For example, TMDB has info on every cast and crew member for every movie. That can be hundreds of people. If you think that the key grip has predictive power, then pull that data in from the API. If you only want to predict Best Picture, then getting the educational background of every supporting actor from Wikidata is probably not important to you.
The enrichment layer is selective by design. The ontology defines what can be attached. The identifiers define what may be retrieved. The modeling goal determines what should be included.
Here is what I pulled in for my expanded graph:
TMDB
Budget, revenue, runtime, vote (average), vote (count), popularity, original language, release date, tagline, genres, rating, production companies.
OMDb
imdb rating, Rotten Tomatoes score, metacritic score
Wikidata
Festival awards (Palm d’Or, Golden Lion, Golden Bear, Big Three Festival, Cannes, Venice Jury Prize, Sundance Grand Jury, Spirit Best Film, NSFC Best Film, NYFC Best Film, LAFCA Best Film, Razzie Worst Picture) Country
This expanded graph has about 625,799 triples or roughly 27 MB. The point is not the size but the flexibility. The foundation remains stable but the surface area of the graph expands based on the question being asked.
🤖 Layer four: Predictive Models
Additional features calculated from the graph
In addition to all of the data we have stored directly in the graph, we can derive a bunch of other useful metrics. For all categories: previous nominations (sum, max, average), previous wins (sum, max, average), number of producers, precursor awards (PGA, DGA, SAG, BAFTA, Globes), acting nominations, directing nomination, writing nominations, editing nomination, cinematography nomination, above-line nominations, technical nominations, music nominations, other nominations. For nominee-level categories (acting, directing, etc.) we also get previous all-Oscar nominations and wins for that individual, plus their category-specific nomination and win history.
Feature selection
My expanded graph gives me between 92 and 96 candidate features to choose from depending on the category.
Now that we have a giant knowledge graph we can search for features that are good at predicting outcomes. I used RFECV (recursive feature elimination with cross-validation) to narrow down the features that are actually predictive. I also apply a concept-aware reduction step before RFECV: within each conceptual group (financial scale, critical reception, popularity, etc.) only the single best-performing representative is kept, so the model isn’t double-counting the same underlying signal. For example, if the Rotten Tomatoes score makes the cut, we don’t also need the Metacritic score. Category-specific precursor awards — like the BAFTA Best Actress winner when predicting Best Actress — are always forced into the model. Generic precursors like PGA or DGA winner have to earn their spot through the same selection process as everything else. The non-negative constraint from the model step handles any correlation between the ones that survive.
Model selection
I compared several approaches — plain logistic regression, random forest, and gradient boosting — but settled on a constrained logistic regression. The key design choice: all precursor award coefficients are forced to be zero or positive. Winning a BAFTA or a Globe can help a nominee’s predicted odds, but it can never hurt them. This sounds obvious, but without the constraint, correlated precursor signals can cause the model to assign negative weight to one of them — essentially penalizing a nominee for winning an award.
Prediction
Here are the model’s top picks across all 20 categories for the 2026 ceremony. Win percentages are normalized probabilities from the model — they show how the model distributes confidence across the field, not raw probabilities.
- Best Picture — One Battle After Another (33%), Sentimental Value (9%), Sinners (9%)
- Best Director — Paul Thomas Anderson (61%), Ryan Coogler (11%), Chloé Zhao (10%)
- Best Actress — Jessie Buckley (56%), Renate Reinsve (13%), Rose Byrne (12%)
- Best Actor — Michael B. Jordan (30%), Timothée Chalamet (23%), Leonardo DiCaprio (18%)
- Best Supporting Actress — Wunmi Mosaku (24%), Teyana Taylor (23%), Amy Madigan (21%)
- Best Supporting Actor — Sean Penn (34%), Stellan Skarsgård (25%), Benicio del Toro (19%)
- Best Adapted Screenplay — One Battle After Another (49%), Hamnet (17%), Frankenstein (14%)
- Best Original Screenplay— Sinners (32%), Marty Supreme (24%), Sentimental Value (19%)
- Cinematography — One Battle After Another (31%), Sinners (26%), Frankenstein (16%)
- Film editing — One Battle After Another (38%), Sinners (20%), Marty Supreme (16%)
- Original Score — Sinners (40%), Hamnet (21%), OBAA (19%)
- Original Song— KPop Demon Hunters (40%), Sinners (19%), Train Dreams (18%)
- Production Design— Sinners (25%), OBAA (24%), Hamnet (19%)
- Sound—F1 (28%), Sinners (24%), OBAA (22%)
- Visual Effects — Sinners (40%), Fire and Ash (22%), F1 (17%)
- Makeup & Hairstyling — Frankenstein (31%), Sinners (21%), Kokuho (18%)
- Costume Design— Frankenstein (30%), Hamnet (21%), Sinners (21%)
- Animated Feature— Zootopia 2 (33%), KPop Demon Hunters (29%), Little Amélie or the Character of Rain (14%)
- Documentary Feature— Mr Nobody Against Putin (35%), The Perfect Neighbor (20%), Come See Me in the Good Light (17%)
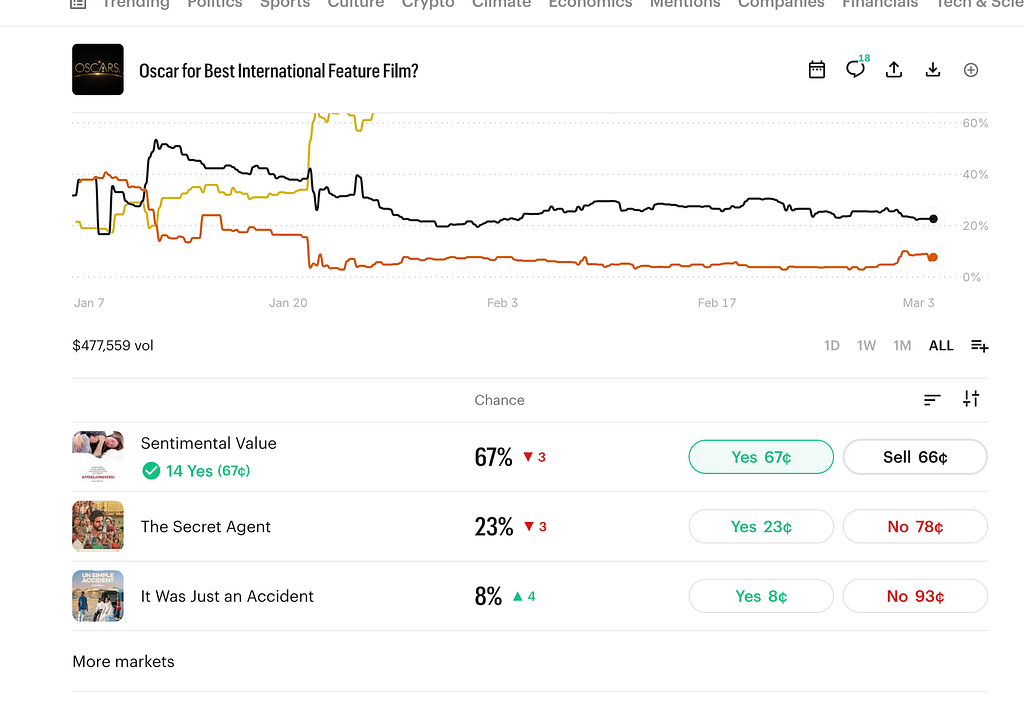
- International Feature Film — Sentimental Value (38%), The Secret Agent (18%), It Was Just an Accident (17%)
A few things jump out.
- Best Director is the model’s most confident call. Paul Thomas Anderson leads at 60.5% — the DGA win, BAFTA director win, and Globe director win give him a precursor sweep that the model treats as near-decisive. The remaining four directors are bunched between 8.8% and 10.7%.
- Best Actress is nearly as lopsided. Jessie Buckley sits at 55.8%, more than four times the next closest competitor. She swept BAFTA, SAG, and the Globe — historically, that combination almost never loses.
- Best Actor is the tightest major race. Michael B. Jordan edges Timothée Chalamet 30.2% to 22.9%, with DiCaprio and Moura both in the mid-teens. No precursor sweep here: Jordan took SAG, Chalamet took the Globe, and BAFTA went elsewhere. The model sees a genuine three-way race where prediction markets have largely settled on Chalamet.
- Best Supporting Actor is where the model disagrees with the market most. Sean Penn leads at 34.2% with Skarsgård close behind at 24.5%. Prediction markets have Penn at 78% — the model sees it as much more competitive, partly because Skarsgård’s BAFTA and Globe supporting actor wins carry real weight.
- Best Supporting Actress is wide open. The top three — Mosaku (23.6%), Taylor (23.1%), and Madigan (21.0%) — are essentially within noise of each other. This is the category the model is least confident about.
- One Battle After Another dominates the above-the-line categories. It leads Best Picture (33.1%), Best Director (60.5%), Adapted Screenplay (48.5%), Film Editing (38.0%), and Cinematography (30.9%). Its nomination count and precursor wins make it the model’s most decorated film.
- Sinners is the technical juggernaut. With 16 nominations — a record — it leads Original Screenplay (32.0%), Original Score (40.0%), Production Design (25.0%), Sound (24.2%), and Visual Effects (40.3%). Ryan Coogler’s film racks up wins in categories where sheer nomination volume and film-level precursor signals carry the day.
- Frankenstein owns the craft pair. It takes Makeup (30.6%) and Costume Design (29.8%), both driven by its BAFTA wins in those categories.
- The model runs cooler than the markets everywhere. Prediction markets show 80–95% favorites in most categories; our model’s highest confidence is 60.5%. This is partly by design — ConstrainedLR with non-negative precursor constraints produces well-calibrated but conservative probabilities — and partly because the model lacks late-breaking signals like guild buzz and campaign momentum that bettors price in.
- NOTE: I will almost certainly be changing these predictions in the days before the actual ceremony. A lot can happen in 12 days, including the Writers Guild of America (WGA) Awards. I will log any predictions in my knowledge graph here. The model can change. The infrastructure remains.
Conclusion
This is meant to be an illustrative example of how a semantic data stack can be implemented to do all kinds of things, including predictive model generation. This data foundation can also be used to answer questions directly, create dashboards and visualizations, explore relationships across films and awards, and support decision-support tools. This can be done via SPARQL queries against the underlying graph, but also by working with AI agents. If you clone this repo (linked above) and ask your coding agent to review it, you can immediately start asking movie questions and building models. I tried this from a clean slate and asked it to predict who will win the Oscar for Best International Film:
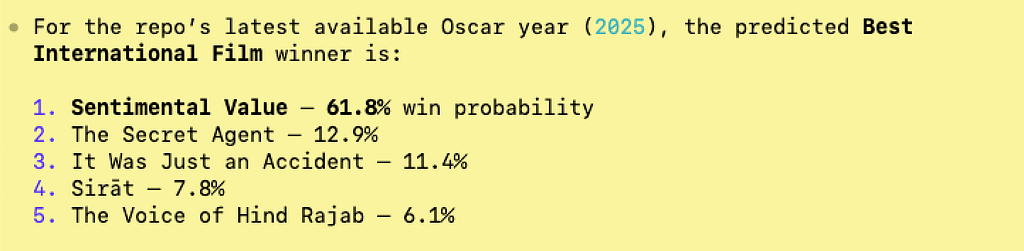
My agent was able to build a predictive model for this category with no additional prompts.
I asked it what features it used to make this prediction and it showed me:

It didn’t expand the graph using the APIs from TMDB or OMDB, it just used the data in the repo: information about precursor awards and other nomination. Even still, the 61.8 percent win probability for Sentimental Value is actually very close to the current market odds:
Feel free to play around with this and let me know if you find it useful or not!
Using a Knowledge Graph to Generate Predictive Models for the Oscars was originally published in Towards AI on Medium, where people are continuing the conversation by highlighting and responding to this story.