
Explain Linear Regression to Me Like I am a 5-Year-Old

Hello everyone, this blog is part of a series of blogs I am preparing called “explain Machine learning Concept X to me like a 5 year old”. As I was once told “you don’t truly understand a concept until you can explain it simple enough a 5 year old can understand it”.
This is my personal take to refresh on basic machine learning concepts in a general manner, and is meant in no way to be a text book technical deep dive on the mathematical concepts but rather as a mere introduction which allows you to then further explore. Also, I am forcing myself to stay away from AI chatbots writing assistance, so bare with my grammar.
So Let’s dig right into it: WHAT IS LINEAR REGRESSION ?? and WHY IS IT MENTIONED EVERY TIME SOMEONE TALKS ABOUT MACHINE LEARNING??
I will take a safe assumption that you’re not a machine learning expert reading this post and bore you with some basic concepts by answering the second question
Why is Linear Regression mentioned at every machine learning course Introduction:
let’s start by going over a common definition of machine Learning:
“ Field of study that gives the computers the ability to learn without being explicitly programmed.” (Arthur Samuel, 1959)
so how does it learn then ? The simplified answer is FROM EXAMPLE DATA
In its simplest rudimentary forms machine learning can take the form of finding the best line that can represent a bunch of data points of input X and known output y so we can predict or estimate outputs of other points that have their outputs unknown -> which is basically linear regression. did I lose you there?
Say for example you are trying to see how much your house is worth in the market based on its size: you check some database that shows recent figures of some other houses sold in your neighborhood that looks like this:
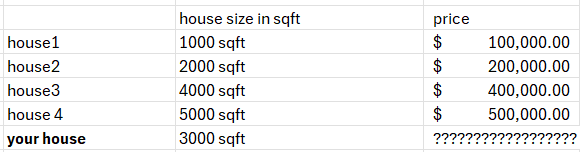
Just looking at this you might say, well I’ll list my house for 300k. CONGRATS ! you just approximated what a simple MACHINE LEARNING algorithm would compute.
To be more specific you, mentally and probably within a few seconds, performed a linear regression, which is a form of supervised machine learning. From the previous input data with known targets, and without explicitly knowing the predefined formula for predicting house prices, you inferred a linear relationship between input variable x (the house size in sqft) and the output target y (the price). You assumed the relationship looks something like this:
y (house price) = x (house size) * 100
you then used this function to predict the the target unknown variable y(price) for input data x. Obviously in real life, there are a million other variables that influence a house’s price, and real life input- target relationships are rarely exactly linear but understanding linear Regression is essential to understanding any further more complex ML Algorithm, and you’d be surprised to know that most of the complex AI models today go back to repeated linear transformations of the form y = Wx + b combined with nonlinear activation functions. Now let’s go back to the main question for today:
What is Linear Regression
By now , I assume you kind of have an idea of where I am going. Based on what we talked about earlier: Linear Regression is a supervised machine learning algorithm that models the relationship between a continuous dependent variable (target) and one or more independent variables (input features) by fitting a straight line.
Let’s clarify some of the terminology:
in our previous example: — The size of the house was our input variable or feature , — The house price was our output or target variable, we had n=4 examples dataset of known houses sizes and their corresponding prices which we call the Training Dataset.
so we established that the goal of linear regression is to come up with a function to represent the relationship between our inputs and target, described by the basic line function slope (let’s call it w) and y intercept (let’s call it b), so like our example, one input variable function looks like this.

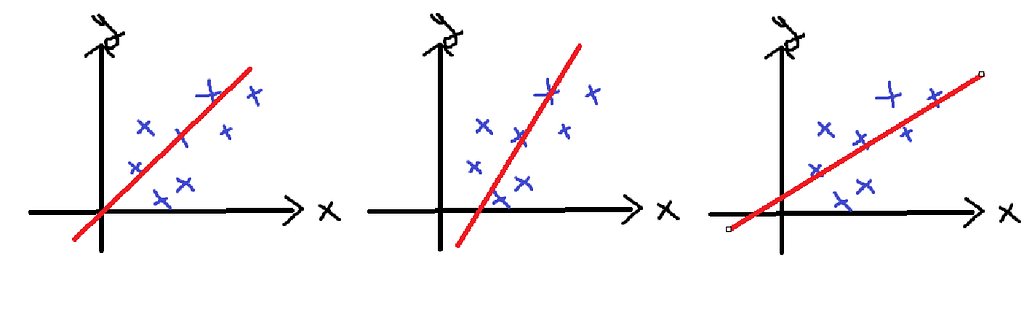
Now in our previous trivial example to estimate our house price, we mentally inferred w = 100, and b=0, but how does this process work when the training data isn’t trivial. Say for example if we plot our input feature x vs our target y we get the plot below. If you try to visually decide which line best describes our data, the w and b wouldn’t be such a straightforward answer.
See we need a way to measure how well a function (in our case a line) fits our training data, or how much it costs to be off this data. We call this the:
Cost Function
The purpose of the cost function is measure the difference between the real target variable y and our model’s prediction (the Hypothesis Function let’s call it y^). In the graphs above, this translates to basically measuring per point, how far off the red line is (which is our prediction function) from the real outputs in blue.
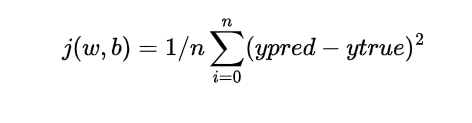
For linear regression, one of the most common cost functions used is the Mean Squared Error function which can be represented as the average of the squared sum of the difference of every point’s prediction vs target in our n training dataset.
Ok so we have the idea: high cost function =our model is predicting results way off the real target = bad, low cost function = our predictions are close to target variable =good => So the model’s goal is to find the best (w,b) to minimize our cost function j. But how does the model Learn to do it on its own??
Optimization Algorithm
An optimizer is an algorithm whose job is to find the parameter values (like w and b) that minimize the cost function. A very popular Optimizer in machine learning and deep learning applications is Gradient Descent. Now I could write a full blog if I wanted to go into the details of Gradient Descent so for the purpose of keeping the level of this blog introductory i’ll brush off its basic concepts.
Gradient Descent is an iterative process, that aims to reach the best parameters w,b that minimize the loss function by taking one small step in the right direction at a time. As if you are standing on a hill in foggy weather and you want to reach the lowest point of land nearby, you can’t see far ahead, so you move in the direction that looks downward sloped from where you’re standing, one step at a time. Hence the “Gradient Descent” naming terminology… 🤯
Inorder to do that, it first assigns random values to w and b, then starts the iterative process: calculate the gradient of the cost function with respect to w and b separately, the update the value of w in the negative direction of the slope by the scale of a step (because it’s aim is to reach the lowest value of the cost function) . We call the size of that step the learning rate and notate it by α.
So the model keeps repeating this process:
Make a prediction using current w and b (they get randomly assigned on the first round often with common practice of w to1, b to 0)
Measure how wrong it is using the cost function
Adjust w and b by the scale of the learning rate to reduce the error


Repeat again and again
After many small updates, the line slowly shifts and rotates until it fits the data as best as possible. When the cost function becomes very small (or stops improving much), we say the model has converged — meaning it has learned the best possible line for that data. Below is a visualization (in red) of the of how the algorithm starts with randomly assigned parameters that yield high loss and converges using GD to the best w,b values to minimize the cost function. Note: the terminology below uses θ0 for b and θ1 for w.

So there you have it, in it’s most basic forms this is how linear regression algorithm works in principle, of course realistically there are many additions that follow with real life problems. It can naturally transform to multiple variable linear regression as the input features increase, you can start add regularization techniques to prevent the model from over assuming patterns of seen training data to the new unseen datapoints, you can experiment with different optimizers and cost functions but the principle stays the same.
Congrats on finishing this, I find that if you understand Linear Regression, you understand the backbone of machine learning and if you can explain it simply — you probably understand it even better.
Explain Linear Regression to Me Like I am a 5-Year-Old was originally published in Towards AI on Medium, where people are continuing the conversation by highlighting and responding to this story.