
Evaluating Recommender Systems Beyond Accuracy
Why coverage, diversity, stability, and calibration determine success in production
Recommender systems are rarely judged in the environment where they actually succeed or fail.
In development, models are evaluated offline using familiar metrics such as Recall@K, Precision@K, and NDCG. These metrics are popular for good reason: they are easy to compute, easy to compare across experiments, and easy to optimize. They answer a narrow but useful question:
How well does a model rank items that users have previously interacted with?
That question is necessary — but it is not sufficient.
Once recommender systems move into production, they stop being static ranking functions. They become live systems that control exposure, influence user behavior, retrain continuously, and operate under latency, reliability, and business constraints. The moment a recommender goes live, it begins shaping the very data it will later learn from.
After deploying recommender systems in real-world environments, one pattern becomes hard to ignore:
Models that look strong offline can still fail quietly in production.
High-performing teams, therefore, stop asking only:
Is this model more accurate than the last one?
Instead, they ask:
Is this system behaving well over time?
Answering that question requires evaluation beyond accuracy.
Why Accuracy Breaks Down in Production
Accuracy metrics optimize for reproducing historical behavior under assumptions that rarely hold once systems go live:
- User preferences are assumed to be static
- Observations are treated as independent
- Interaction data is assumed to be unbiased
Production recommender systems violate all three assumptions.
Live systems:
- Shape what users see
- Create feedback loops between exposure and interaction
- Interact with operational and business constraints
- Evolve continuously through retraining and traffic shifts
As a result, a highly accurate model can still:
- Concentrate exposure on a small subset of items
- Produce repetitive or stale user experiences
- Change behavior unpredictably across retraining cycles
- Optimize short-term engagement while degrading long-term value
Accuracy remains necessary — but it is no longer sufficient.
One reason these failures are difficult to diagnose is that accuracy metrics often remain healthy even as system behavior degrades. Offline evaluations rarely capture exposure concentration, user fatigue, or instability introduced by retraining pipelines. As a result, teams may ship multiple “improvements” before realizing that engagement has plateaued or declined for reasons their metrics cannot explain.
In production environments, recommender systems must therefore be evaluated not only as predictive models, but as dynamic decision systems embedded in feedback loops. Evaluation must account for how recommendations influence future data, how systems evolve, and how users perceive consistency and relevance. This shift — from model-centric to system-centric evaluation — is where many organizations struggle.
A Layered View of Recommender System Evaluation
A useful way to think about evaluation in production is as a layered stack, not a single score.

Accuracy answers how well a model ranks. Beyond-accuracy metrics answer how the system behaves.
No single layer explains system behavior on its own. Insight emerges from observing how these layers interact.
Four Dimensions That Matter Beyond Accuracy
Mature recommender teams augment accuracy with four complementary dimensions:
- Coverage — how much of the catalog the system actually uses
- Diversity — how varied the recommendations are within a list
- Stability — how consistent recommendations are over time
- Calibration — how well recommendations align with user preferences
These metrics do not replace accuracy.
They provide the context required to interpret it safely.
1. Coverage: Measuring What the System Uses
What coverage captures
Coverage measures how broadly a recommender system utilizes the available item catalog.
A model can achieve high Recall@K by repeatedly recommending the same popular items. Coverage reveals whether learning is broad or collapsing.
From a system perspective, coverage is closely tied to exploration. Low coverage often indicates that the recommender has converged prematurely on a narrow slice of the catalog, reinforcing popularity rather than learning user-specific preferences. Over time, this behavior reduces the system’s ability to adapt, particularly for new users, new items, or seasonal shifts in demand.
Importantly, coverage is not just a catalog metric — it is also a proxy for learning capacity. A system that rarely explores cannot collect diverse signals, making future personalization increasingly brittle.
Low coverage often precedes:
- Popularity bias
- Reduced discovery
- Feedback loop amplification
In practice, many teams monitor weekly catalog coverage alongside Recall@K to detect early signs of popularity collapse before engagement metrics degrade.
Common coverage metrics
Catalog coverage

Measured over a defined time window (daily or weekly).
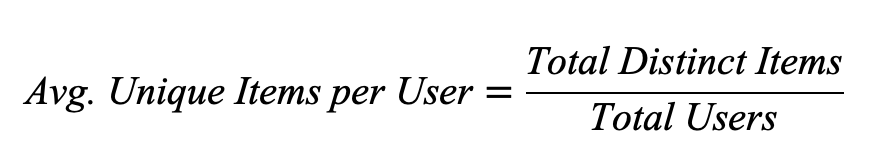
User-level coverage
Practical guidance
- Track coverage over time, not just per experiment
- Segment by user cohort (new vs. returning users)
- Watch trends, not just absolute values
A steady decline in coverage is often an early warning sign of system collapse.
2. Diversity: Measuring Variety Within Recommendations
What diversity captures
Diversity measures how different items are within a single recommendation list.
Two models can have identical accuracy while producing very different user experiences. One may recommend near-duplicates; another may surface genuinely distinct options.
Accuracy metrics treat each recommendation independently, ignoring relationships between items in a list. From a user’s perspective, however, recommendations are consumed as a set, not as isolated predictions. A list composed of near-identical items may technically be accurate while offering little incremental value.
Diversity metrics make this implicit structure explicit. They capture list-level quality that accuracy metrics fundamentally cannot observe, helping teams distinguish between models that optimize ranking and systems that optimize experience.
Diversity supports:
- Exploration
- Reduced user fatigue
- Better perceived relevance
Common diversity metrics
Intra-List Diversity (ILD)
Using item similarity s(i,j)

Similarity can be computed using:
- Metadata
- Learned embeddings
- Category overlap
Category diversity
- Number of unique categories represented in the top-K recommendations
Practical guidance
- Use a consistent similarity definition across experiments
- Compare diversity relative to a baseline
- Treat diversity as an observed constraint, not a primary objective
3. Stability: Measuring Consistency Over Time
What stability captures
Stability measures how much recommendations change when underlying signals have not meaningfully changed.
Excessive churn leads to:
- Inconsistent user experiences
- Debugging difficulty
- Reduced trust in the system
Some change is expected. Uncontrolled change is not.
Stability becomes especially important in environments with frequent retraining, feature refreshes, or upstream data changes. Without explicit stability monitoring, teams may misattribute performance fluctuations to modeling choices when the true cause lies in data drift, pipeline timing, or training variance.
In practice, stability metrics often serve as an operational guardrail. They help teams detect when a system is changing faster than users can adapt, even if traditional engagement metrics remain temporarily stable.
Common stability metrics
Ranking churn

Score drift
- Track distribution shifts in predicted scores across retraining cycles
Practical guidance
- Measure stability across retraining runs
- Segment by user cohort
- Treat excessive churn as a risk signal, not innovation
In production, teams often discover that retraining pipelines introduce more churn than model changes themselves.
Stable systems change deliberately.
4. Calibration: Measuring Alignment with User Preferences
What calibration captures
Calibration measures whether recommendations reflect a user’s preference distribution.
A system may be accurate yet still feel “off” if it:
- Over-represents certain categories
- Ignores secondary interests
- Over-optimizes globally popular items
Perceived relevance is inherently subjective, and calibration is one of the few evaluation tools that explicitly addresses this gap. Users rarely want recommendations that maximize a single dominant interest at all times. Instead, they expect systems to reflect the distribution of their preferences, including secondary and emerging interests.
Calibration therefore plays a critical role in trust. When recommendations consistently align with how users understand themselves, systems feel intentional rather than arbitrary — even when accuracy metrics do not change.
Common calibration approaches
Preference distribution matching
Compare the attribute distribution of recommendations to historical user preferences.
Example:
- User history: 60% Category A, 40% Category B
- Recommendations should roughly reflect that mix
Popularity calibration
- Constrain exposure to avoid over-concentration on popular items
Practical guidance
- Evaluate calibration at cohort or segment level
- Treat calibration as a soft constraint, not a hard rule
Calibration often improves perceived relevance without improving accuracy.
How These Metrics Interact with Accuracy
Beyond-accuracy metrics introduce trade-offs:
- Increasing diversity may reduce Recall@K
- Increasing coverage may reduce short-term CTR
- Increasing stability may slow responsiveness
These are not failures. They are design decisions.
The key distinction is intentionality. Unmeasured trade-offs lead to accidental system behavior; measured trade-offs enable deliberate design. By making these tensions visible, teams can align evaluation with product goals, business constraints, and user expectations rather than optimizing blindly for a single metric.
In mature organizations, these trade-offs are often reviewed alongside offline metrics during model reviews, ensuring that improvements are evaluated holistically before deployment.
Connecting Metrics to Business Outcomes
Beyond-accuracy metrics matter because they influence long-term value:
- Coverage → discovery and catalog utilization
- Diversity → reduced fatigue and deeper sessions
- Stability → trust and predictability
- Calibration → perceived relevance
Accuracy often correlates with immediate engagement.
Beyond-accuracy metrics correlate with durability.
Accuracy–Exposure Trade-off Index
One way to reason about system health is to track a composite diagnostic — not as an optimization target, but as an early warning signal:

Where:
- Accuracy = Recall@K or NDCG
- Coverage = catalog or user-level coverage
- Stability = inverse churn or rank overlap
- α,β,γ are interpretive weights, not tuning parameters
This is not a metric to optimize directly. Composite diagnostics like the System Health Index are most effective when used longitudinally. Sudden shifts in one component — such as declining coverage or rising churn — can surface risks weeks before downstream business metrics are affected. Used correctly, these signals function less as scores and more as early-warning indicators for system imbalance.
A rising accuracy term paired with collapsing coverage or stability often predicts long-term degradation.
Feedback Loops and Exposure
To understand why exposure metrics matter so deeply in production, it helps to visualize how recommender systems learn over time.

What users see shapes what the system learns.
What Strong Teams Do Differently
High-performing recommender teams:
- Track beyond-accuracy metrics continuously
- Focus on trends, not point improvements
- Discuss trade-offs openly
- Treat metrics as signals, not verdicts
They recognize that evaluation shapes system behavior.
When to Introduce Beyond-Accuracy Metrics
These metrics become critical when:
- The system is live in production
- Feedback loops form
- Catalog size increases
- Business goals extend beyond short-term engagement
Evaluation maturity should grow with system maturity.
Conclusion: Evaluation as System Understanding
Evaluating recommender systems is not about finding a perfect metric.
It is about understanding how a system behaves as it interacts with users, data, and constraints.
Accuracy tells you how well a model ranks.
Coverage, diversity, stability, and calibration tell you whether the system can endure.
The most effective recommender systems are not the most accurate in isolation.
They are the most thoughtfully evaluated.
In recommender systems, what you measure does more than describe performance — it actively shapes system behavior, and many production failures are slow degradations that accuracy metrics never flag.
Teams that rely solely on accuracy optimize for what is easiest to measure. Teams that evaluate coverage, diversity, stability, and calibration optimize for systems that last.
The difference is not better models.
It is better understanding.
Evaluating Recommender Systems Beyond Accuracy was originally published in Towards AI on Medium, where people are continuing the conversation by highlighting and responding to this story.