
LLM Inference Optimization — Prefill vs Decode
LLM Inference Optimization — Prefill vs Decode
How to split prefill and decode, uncover decode-dominated bottlenecks with vLLM, and cut per-token latency on multi-GPU NVIDIA systems.
The first time we profiled our LLM server, everything looked… fine.
The prompt loaded instantly. GPUs were pegged at ~90% utilization. Memory usage was flat and stable.
And yet — the response still took nearly four seconds to finish generating.
We restarted the server, isolated a single request, and pulled phase-level metrics:
Prefill: 48 ms
Decode: 3.9 seconds
Nothing was “broken” — but everything was slow.
This is the trap many teams fall into when serving large language models at scale. Prompt ingestion feels fast, GPUs look busy, and memory graphs look healthy — yet latency explodes the moment generation begins.
The reason is simple, but widely misunderstood: LLM inference has two fundamentally different phases, and almost all real-world latency lives in the second one.
In this article, we’ll break down:
- What actually happens during prefill vs decode
- Why decode dominates latency on multi-GPU systems
- How the KV cache quietly reshapes memory and bandwidth costs
- A reproducible profiling workflow using Prometheus, nvidia-smi, and Nsight
- Concrete, battle-tested optimizations (quantization, FlashAttention, KV paging, NCCL tuning)
- A troubleshooting checklist and A/B playbook you can use in production
If you run LLM inference in production, this is the guide you’ll wish you’d had before your first latency fire drill.
TL;DR
- Prefill and decode are distinct phases — measure them separately
- Decode usually dominates latency for long outputs and multi-GPU setups
- Flat GPU memory early often means KV reservation, not idle execution
- Prometheus + PromQL + NCCL logs + Nsight expose the real bottleneck
- Real performance wins come from decode-focused optimizations, not adding more GPUs
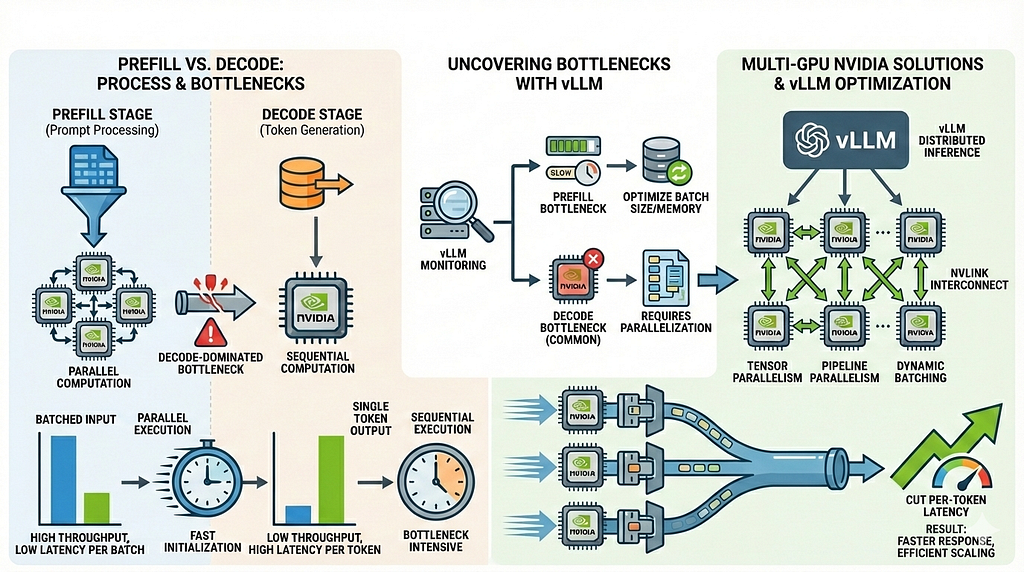
1 — The two phases of inference (and why they behave so differently)
LLM inference looks like a single operation — but under the hood, it’s two very different phases with very different performance characteristics.
Prefill (prompt ingestion)
- Processes the entire prompt in one or a few forward passes
- Initializes KV cache entries for all prompt tokens
- Highly parallel across tokens
- Typically fast (tens to hundreds of milliseconds)
Decode (autoregressive generation)
- Happens once per generated token
- One forward pass per token
- Reads and writes the KV cache at every step
- Attention cost grows with sequence length
- On tensor-parallel setups, triggers inter-GPU collectives on every step
Why this distinction matters
For short prompts, prefill is noticeable.
For real workloads — long answers, chats, or tool calls — decode dominates total latency.
Optimizing prefill helps a little.
Fixing decode is where real gains come from.
2 — Why multi-GPU inference changes everything
Large FP16 models simply don’t fit comfortably on a single GPU.
A ~13B parameter model already needs:
- ~26 GB just for weights
- Additional runtime buffers
- A KV cache that grows with context length
On 24 GB GPUs, this leaves little headroom — which is why multi-GPU tensor parallelism becomes the default in practice.
What tensor parallelism actually introduces
Tensor parallelism:
- Splits model weights across GPUs
- Requires GPUs to exchange partial results during many layers
- Relies on NCCL collectives (all-gather, reduce-scatter, etc.)
This matters because communication is now part of every forward pass.
Why decode suffers more than prefill
- Prefill processes the entire prompt in one or a few passes
→ Communication overhead is amortized. - Decode runs one forward pass per generated token
→ The same collectives fire again and again.
As sequences get longer, decode latency becomes dominated by:
- GPU memory bandwidth
- Inter-GPU communication
- Or both — often at the same time
At this point, you’re not compute-bound anymore.
The practical takeaway
Adding GPUs solves the memory problem —
but it often creates a new latency bottleneck during decode.
That’s why multi-GPU inference demands different measurement, tuning, and expectations than single-GPU runs.
3 — The KV cache: reserved memory vs real growth
Frameworks like vLLM often pre-allocate a large KV cache pool at startup.
This avoids memory fragmentation and enables features like continuous batching — but it also causes a very common misread during debugging.
“GPU memory is already full — the KV cache must be full too.”
Not necessarily.
What you’re often seeing is reservation, not consumption.
How to tell what’s actually happening
- GPU memory plateaus immediately after init
→ Likely KV cache pre-reservation, not prompt-driven growth. - During decoding, KV grows inside the reserved pool
→ nvidia-smi won’t show incremental increases. - Framework logs are the source of truth
→ vLLM typically prints memory budgeting and KV allocation details at startup. - Sample memory over time for sanity checks
nvidia-smi --query-gpu=memory.used --format=csv -l 1
The key insight
Flat GPU memory does not mean the system is idle —
it usually means the framework already planned ahead.
Misreading this leads teams to chase the wrong bottleneck, add GPUs unnecessarily, or disable useful features.
Flat memory ≠ idle system.
4 — Measuring the truth: prefill vs decode with Prometheus
You can’t optimize what you don’t measure — and aggregate “inference latency” hides the real problem.
To debug LLM performance correctly, you need phase-level metrics that separate prefill from decode.
PromQL
Compute average time per request over a fixed window:
# Average decode time per request (last 5 minutes)
increase(vllm:request_decode_time_seconds_sum[5m]) /
increase(vllm:request_decode_time_seconds_count[5m])
# Average prefill time per request (last 5 minutes)
increase(vllm:request_prefill_time_seconds_sum[5m]) /
increase(vllm:request_prefill_time_seconds_count[5m])
Important: This assumes no overlapping requests during measurement.
For controlled experiments, restart the server or isolate traffic.
Clean, reproducible profiling workflow
Follow this sequence exactly to avoid misleading data:
- Restart the server
Resets Prometheus counters so deltas are clean. - Run one controlled request
Fixed prompt, fixed max_tokens, no concurrent traffic. - Pull Prometheus metrics
Compute average prefill vs decode using the queries above. - Observe GPU behavior in parallel
watch -n1 nvidia-smi
Look for utilization, memory plateaus, and balance across GPUs.
5. Enable NCCL logging (multi-GPU only)
export NCCL_DEBUG=INFO
export NCCL_DEBUG_SUBSYS=ALL
Confirms whether decode steps are triggering collectives.
6. Capture a timeline
Use Nsight Systems or PyTorch Profiler / NVTX to visualize:
compute → communication → idle gaps.
At this point, you’re no longer guessing.
You know whether you’re compute-bound, memory-bound, or communication-bound — and which phase is responsible.
5 — A real benchmark
Workload: single long-form generation request on a tensor-parallel, multi-GPU setup
Goal: isolate decode behavior under realistic production settings
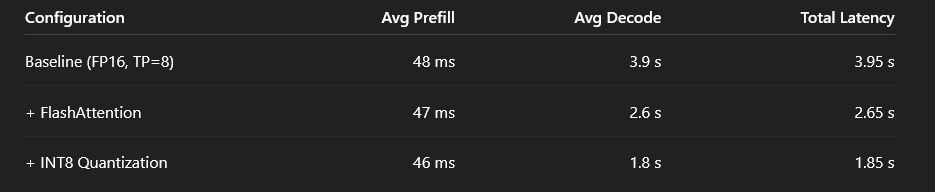
What this shows:
- Prefill time barely changes across configurations
- Decode latency drops by more than 50% with targeted optimizations
- End-to-end latency improvements come almost entirely from fixing decode
Prefill is a rounding error.
Decode is the bill you actually pay.
6 — Profiling tools
Use the highest-level tool that answers the question before going deeper.
- Prometheus / Grafana
Phase-level trends (prefill vs decode), long-term visibility, and alerting.
Best for detecting regressions and tracking improvements over time. - nvidia-smi (sampling)
Fast sanity checks on memory usage and GPU utilization.
Useful for spotting pre-reserved memory and obvious under-utilization. - NCCL debug logs
Visibility into inter-GPU communication and collective operations.
Essential when decode latency scales poorly with more GPUs. - Nsight Systems
End-to-end timelines showing compute, memory copies, and NCCL activity.
Best tool for identifying idle gaps and synchronization stalls. - Nsight Compute
Kernel-level analysis and hardware efficiency.
Use only after you know which kernels are slow and why. - PyTorch Profiler / NVTX
Correlates application code paths with GPU events.
Ideal for mapping framework logic to timeline behavior.
7 — Decode-focused optimization strategies
These levers target the token-by-token decode loop, where most real-world latency lives.
- Quantization (INT8 / 4-bit)
Large reductions in model memory footprint and memory bandwidth.
Usually the biggest single win, with a small and controllable accuracy trade-off. - FlashAttention / fused attention kernels
Cuts memory movement and improves attention efficiency.
Often a low-effort, high-impact improvement when supported by your framework. - KV paging (PagedAttention)
Critical for long-context or chat workloads.
Keeps hot KV on GPU while paging cold entries, trading occasional page faults for stability. - CPU / NVMe offload
Allows larger models or contexts without adding GPUs.
Cheaper infrastructure-wise, but adds per-token latency when offload paths are slow. - Continuous batching
Amortizes compute and communication across requests.
Boosts throughput, but can increase tail latency for single-user requests. - NCCL & topology tuning
Non-optional for multi-GPU deployments.
Poor interconnect configuration can erase gains from every optimization above.
8 — vLLM launch flags
python -m vllm.entrypoints.openai.api_server
  --model meta-llama/Llama-2-13b-chat-hf
  --tensor-parallel-size 8
  --gpu-memory-utilization 0.90
  --max-model-len 4096
  --port 8000
What each flag really means in practice
- –tensor-parallel-size
Number of GPUs that share a single model replica.
Higher values reduce per-GPU memory pressure but increase per-token communication cost during decode. - –gpu-memory-utilization
Fraction of GPU memory vLLM will plan and reserve up front for weights, KV cache, and runtime buffers.
Higher values allow larger contexts and batching, but reduce headroom and increase OOM risk under load. - –max-model-len
Upper bound on supported context length.
This directly influences KV cache size, memory reservation, and worst-case decode latency.
Important nuance
Lowering gpu-memory-utilization may appear to reduce memory usage, but can silently cap batch size or trigger paging — which often hurts decode latency more than it helps.
9 — Fast troubleshooting checklist
Use this when latency spikes and you need answers fast.
- Decode ≫ Prefill?
→ Focus on KV cache pressure and inter-GPU communication costs. - GPUs evenly utilized but latency still high?
→ Inspect NCCL collectives and synchronization overhead. - GPU memory flat immediately after startup?
→ Likely KV pre-reservation, not active growth. Confirm via framework logs. - Idle gaps visible in timeline traces?
→ Look for synchronization stalls or communication waits between kernels. - Latency increased after adding GPUs?
→ Suspect topology issues, NCCL configuration, or excessive per-token syncs.
10 — A/B playbook: prove improvements, don’t assume them
Treat inference optimization like an experiment, not a hunch.
Run the exact same request N times and compare results across controlled variants:
- Baseline (no optimizations enabled)
- FlashAttention enabled
- Quantized weights
- KV paging enabled
- NCCL tuned (topology, algorithms, env vars)
Keep everything else constant: prompt, batch size, max tokens, hardware, and concurrency.
Measure using PromQL counters and timelines, not wall-clock impressions.
If you can’t reproduce the result, it’s not an improvement — it’s noise.
Key takeaways
- Measure prefill and decode separately — aggregate latency hides the real bottleneck
- Decode dominates end-to-end latency in real production workloads
- KV cache behavior is frequently misinterpreted, especially with pre-allocation strategies
- High GPU utilization does not imply efficient execution — communication and memory traffic still matter
- Optimizing without measurement is guessing, not engineering
Make it measurable. Then make it fast.
LLM inference doesn’t fail because models are inherently slow.
It fails because decode behavior stays invisible until you measure it explicitly.
Once you separate prefill from decode and put real numbers behind them, performance stops feeling mysterious — and starts becoming something you can systematically fix.
That’s the difference between guessing and engineering.
❤️ Thanks for reading.
If this helped you see LLM inference a little more clearly, consider clapping, saving, or following for more practical, production-grounded AI engineering playbooks.
LLM Inference Optimization — Prefill vs Decode was originally published in Towards AI on Medium, where people are continuing the conversation by highlighting and responding to this story.