Getting Started with Streamlit: Learn Widgets, Layouts, and Caching
Table of Contents
-
Getting Started with Streamlit: Learn Widgets, Layouts, and Caching
- Introduction
- What Is Streamlit?
- How Streamlit Works (Under the Hood)
- Configuring Your Development Environment
- Project Structure
-
Understanding the Helper Modules (config.py and data_loader.py)
- Your First Streamlit App: Hello + Core Widgets
- Expanding the App: Dataset Preview + Widget Playground
- Structuring Your Layout: Columns + Metrics
- Speeding Things Up with Caching (@st.cache_data)
- Summary
Getting Started with Streamlit: Learn Widgets, Layouts, and Caching
In this tutorial, you’ll learn how to build your very first interactive web app using Streamlit — all in pure Python, no HTML or JavaScript required. We’ll start by exploring how Streamlit transforms a simple script into a reactive app, walk through its core widgets and layout options, and wrap up by adding caching to make your app fast, efficient, and ready for real-world use.
This lesson is the 1st of a 3-part series on Streamlit apps:
- Getting Started with Streamlit: Learn Widgets, Layouts, and Caching (this tutorial)
- Lesson 2
- Lesson 3
To learn how to turn your Python script into a live Streamlit app, just keep reading.
Introduction
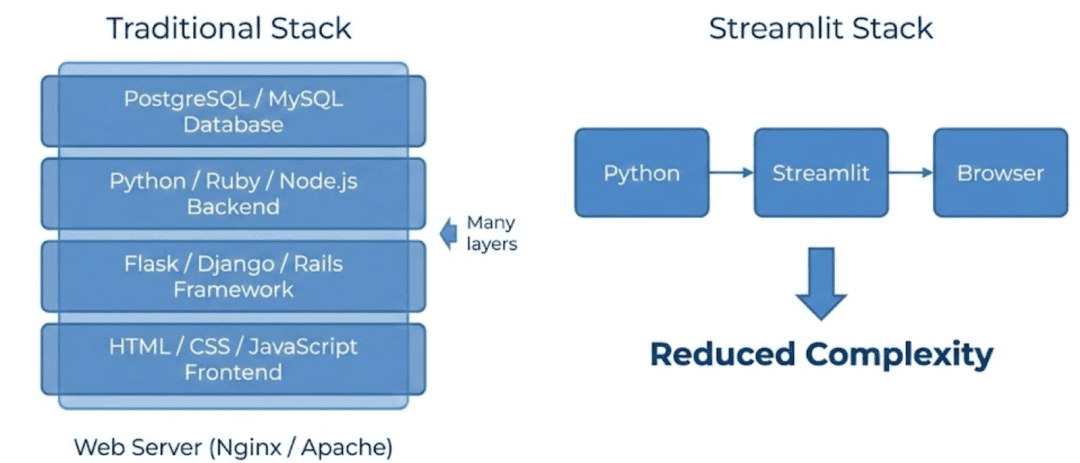
If you’ve ever built a machine learning model or data pipeline and wanted others to see it in action, you’ve probably faced a familiar dilemma: you know Python, not web development.
Frameworks like Flask or Django are powerful but require juggling routes, templates, HTML, CSS, and JavaScript — all before your model even runs. That friction often delays or derails your demo.
Streamlit changes that completely.
It turns your Python scripts into interactive web apps in minutes — with no front-end code, no configuration, and no deployment headaches. You can focus entirely on logic, visuals, and results, while Streamlit handles the user interface (UI), reactivity, and state management behind the scenes.
In this first lesson, we’ll go from a blank file to a working Streamlit app that responds to user input, displays data, and even caches expensive computations for speed. You’ll also learn the underlying execution model that makes Streamlit so intuitive once you understand its rerun cycle.
By the end, you’ll not only know how to write a Streamlit app — you’ll understand why it feels so fast to build with and how it fits naturally into your existing Python workflow.
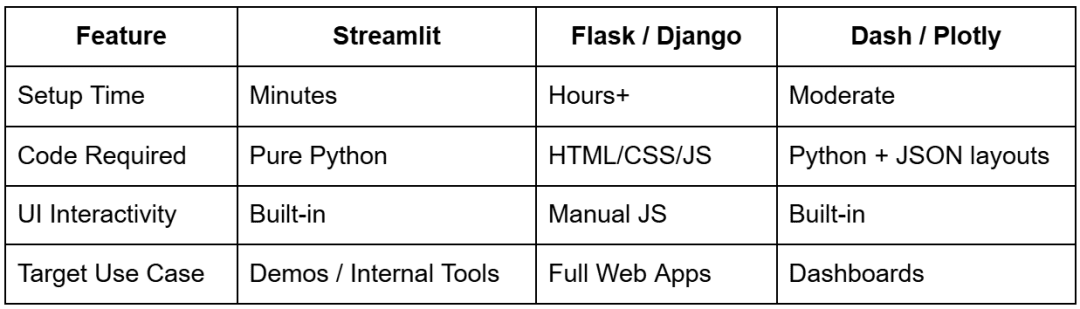
What Is Streamlit?
At its simplest, Streamlit is a Python framework that turns scripts into interactive web apps — instantly, without HTML, CSS, or JavaScript. Each Streamlit command (st.*) adds a new UI element to the page: a slider, a chart, a data frame, or even an entire layout section. You just write Python, and Streamlit takes care of rendering it in the browser.
That’s why Streamlit has become a go-to for data scientists and ML engineers: it collapses the distance between experimentation and demonstration. Instead of saying “I’ll make a web UI later,” you can show your work right now.
Why Developers Love Streamlit
- Simplicity: Build complete interfaces in pure Python — no HTML templates or JavaScript required.
- Reactivity: Streamlit automatically reruns your script every time a user interacts with a widget (e.g., dragging a slider or typing text).
- Integration: Works seamlessly with libraries you already use (e.g., pandas, NumPy, matplotlib, Plotly, Altair, and scikit-learn).
- Speed: Save your file, and the browser updates instantly (no server restart or manual refresh needed).
- Deploy Anywhere: From local demos to Streamlit Cloud, AWS, or Docker containers, it runs almost everywhere Python does.
Real-World Example
Imagine you’ve trained a model that predicts customer churn. With Streamlit, you can build a simple dashboard where teammates upload customer CSVs, adjust thresholds, and instantly visualize churn probabilities — all from your Python environment. No web server setup, no frontend build tools. You get an interactive demo in minutes, not weeks.
Under the Hood
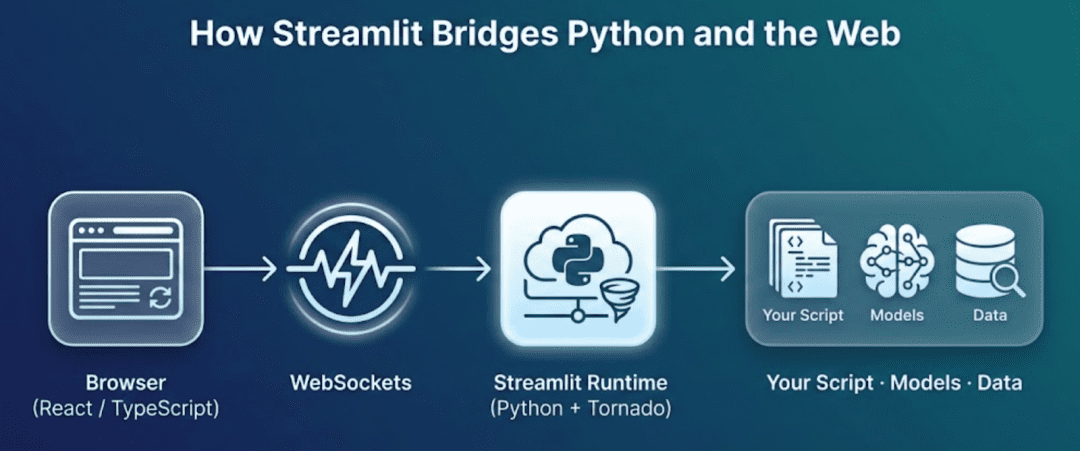
When you run a Streamlit app, two key components spin up:
- Backend: A lightweight Tornado-based Python server executes your code, tracks widget state, and streams results to the frontend.
- Frontend: A React + TypeScript app running in your browser renders everything visually and sends back widget updates over a WebSocket connection.
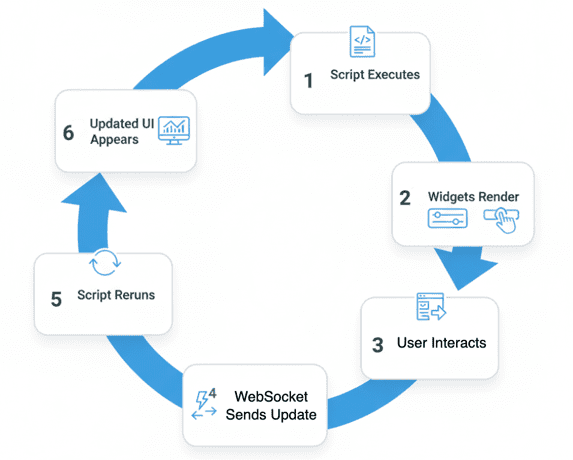
Each user action (like adjusting a slider) sends a message to the backend, which re-executes your script top-to-bottom with the updated values. That new “frame” is then re-rendered in the browser. This cycle gives Streamlit its trademark reactive feel — it’s Python behaving like a web app.
Pro Tip: Think of Streamlit as “a Python notebook that lives in your browser, with interactivity built in.”
How Streamlit Works (Under the Hood)
When you run your first Streamlit app, it might look like a normal website — but under the hood, it works very differently from Flask, Django, or any traditional web framework. Instead of handling routes and templates, Streamlit re-executes your Python script top to bottom every time a user interacts with it.
This rerun model is what makes Streamlit reactive and effortless to reason about.
Step-by-Step Execution Cycle
Let’s break it down:
- Startup: You launch your app using
streamlit run lesson1_main.py
- Streamlit starts a local Python server (usually at
http://localhost:8501) and opens your default browser. - Initial Render: The script (
lesson1_main.py) runs once, line by line. Every Streamlit command (e.g.,st.title(),st.slider(), orst.write()) adds a new element to an internal “page plan” that defines what your app looks like. - Widget State Tracking: Streamlit automatically keeps track of widget values (e.g., which number is selected on a slider or what text is typed in a box). Each browser session gets its own state.
- Interaction Event: When a user changes something (moves a slider, clicks a button, or uploads a file), the frontend sends the updated widget state to the backend over a WebSocket connection.
- Rerun Trigger: The backend re-executes your Python script from the top, using the new widget state. Importantly, your script isn’t a persistent loop — it’s a function of the current inputs.
- Efficient Re-render: Streamlit’s runtime compares the new “page plan” to the previous one and only updates the parts that have changed. The result feels instant and seamless.
Why This Model Works
This approach might sound wasteful at first (rerunning the script on every click?), but it’s actually elegant and predictable. You never have to think about asynchronous callbacks, thread locks, or manual state management — Streamlit handles that for you.
By keeping your script purely declarative, you ensure that each interaction results in a consistent UI derived from the current inputs. When combined with caching (using @st.cache_data or @st.cache_resource), it’s also extremely performant.
Mental Model
Think of your Streamlit app as: A Python function that turns inputs (widget state) into outputs (UI elements), re-evaluated whenever inputs change.
Once you internalize that model, debugging and extending your app becomes straightforward.
Would you like immediate access to 3,457 images curated and labeled with hand gestures to train, explore, and experiment with … for free? Head over to Roboflow and get a free account to grab these hand gesture images.
Configuring Your Development Environment
To follow this guide, you need to have Streamlit and a few supporting libraries installed on your system.
Luckily, Streamlit is pip-installable and works on all major platforms.
$ pip install "streamlit>=1.38,<2" "pandas>=2.2,<3"
Once installed, verify everything is set up correctly:
$ python -c "import streamlit, pandas; print(streamlit.__version__, pandas.__version__)"
You should see version numbers printed in your terminal, confirming that your environment is ready.
Need Help Configuring Your Development Environment?
All that said, are you:
- Short on time?
- Learning on your employer’s administratively locked system?
- Wanting to skip the hassle of fighting with the command line, package managers, and virtual environments?
- Ready to run the code immediately on your Windows, macOS, or Linux system?
Then join PyImageSearch University today!
Gain access to Jupyter Notebooks for this tutorial and other PyImageSearch guides pre-configured to run on Google Colab’s ecosystem right in your web browser! No installation required.
And best of all, these Jupyter Notebooks will run on Windows, macOS, and Linux!
Project Structure
We first need to review our project directory structure.
Start by accessing this tutorial’s “Downloads” section to retrieve the source code archive and example data.
After unzipping the folder, you should see the following layout:
streamlit_project/
├── lesson1_main.py
├── lesson2_main.py
├── lesson3_main.py
├── pyimagesearch/
│   ├── __init__.py
│   ├── config.py
│   ├── data_loader.py
│   ├── visualization.py
│   └── snowflake_utils.py
├── data/
│   └── iris_sample.csv
├── .streamlit/
│   ├── config.toml
│   └── secrets.toml
├── requirements.txt
└── README.md
Let’s briefly understand each part:
lesson1_main.py: The Streamlit app you’ll build in this lesson. It introduces widgets, layout, and caching.lesson2_main.py: Used in Lesson 2 for file uploads, data exploration, and charting.lesson3_main.py: The final app integrating Streamlit with Snowflake for live warehouse data.pyimagesearch/: A lightweight Python package that contains shared helper modules:config.py: Centralized app configuration and settings.data_loader.py: Loads sample datasets (e.g., Iris) efficiently using caching.visualization.py: Contains reusable chart and plotting utilities.snowflake_utils.py: Handles Snowflake connection and query execution (used in Lesson 3).
data/iris_sample.csv: The classic Iris dataset used for early data visualization examples..streamlit/config.toml: An optional file for theming or customizing your app’s layout..streamlit/secrets.toml: To be used in Lesson 3 to store Snowflake credentials securely.requirements.txt: Contains all dependencies for your Streamlit environment.README.md: Overview of the entire mini-course.
Understanding the Helper Modules (config.py and data_loader.py)
Before we start coding our first app, let’s clarify what happens behind the scenes when you import:
from pyimagesearch import settings, load_iris_sample
These come from two lightweight utility files inside the pyimagesearch/ package.
Even though they look simple now, they’ll help keep our code modular and scalable across all lessons.
config.py: Centralized Settings
This file defines a small Settings dataclass that stores global configuration values.
For Lesson 1, only one field really matters:
default_sample_path: str = os.path.join("data", "iris_sample.csv")
That single variable ensures every script knows where to find the Iris dataset.
If you move your data folder later, you only change the path once in this file — not everywhere else in your project.
The other fields you see (e.g., snowflake_user or snowflake_account) are placeholders for Lesson 3, where you’ll integrate a live Snowflake data warehouse. For now, they’re simply initialized as None.
When you import settings, you’re just accessing a frozen instance of this dataclass — a simple, read-only global configuration object.
data_loader.py: Cached CSV Loader
Next comes the data loader:
@lru_cache(maxsize=1)
def load_iris_sample(path: str) -> pd.DataFrame:
    return pd.read_csv(path)
It’s a small wrapper around pandas.read_csv(), with one key addition-@lru_cache(maxsize=1).
This cache ensures that, even if Streamlit reruns your script multiple times (which it will), the CSV is read only once per session.
It’s a teaching-friendly version of what you’ll later do with @st.cache_data when you load larger or remote datasets.
Why This Structure Matters
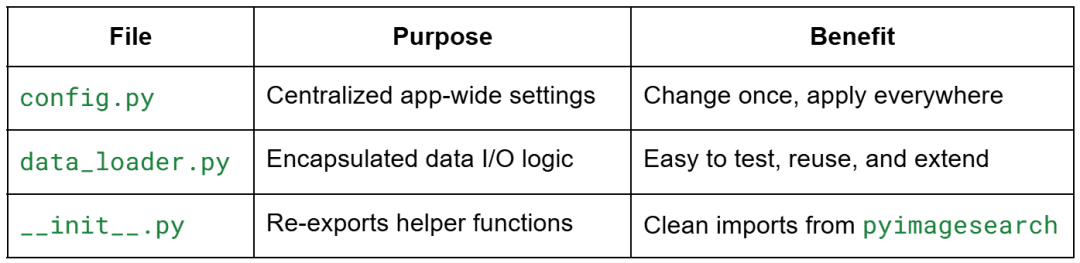
This design might feel formal for a small app. However, it mirrors how production Streamlit projects are organized — making it easy to scale from a toy demo to a maintainable internal dashboard later.
Your First Streamlit App: Hello + Core Widgets
Let’s start by building a simple “Hello Streamlit” app that introduces the essential UI primitives — text, inputs, and interactive widgets.
Create a new file named lesson1_main.py inside your project directory and add the following code:
# lesson1_main.py
import streamlit as st
from pyimagesearch import settings, load_iris_sample
import time
st.set_page_config(page_title="Lesson 1 - Getting Started", layout="centered")
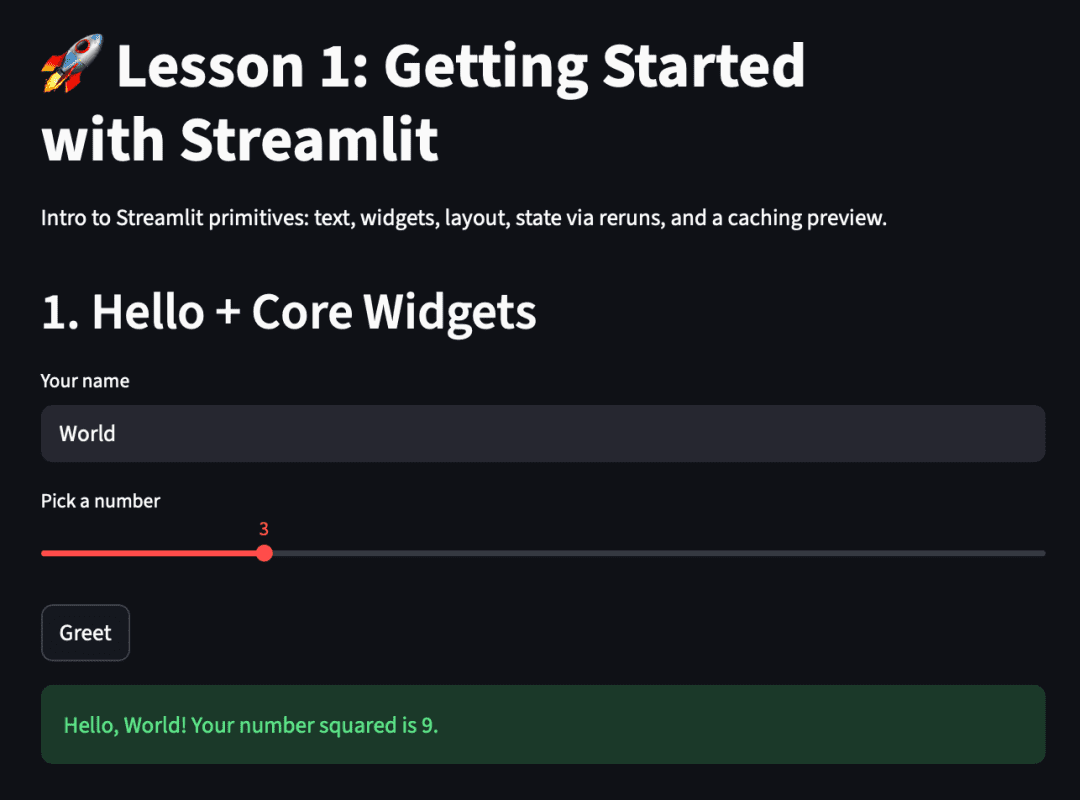
st.title("🚀 Lesson 1: Getting Started with Streamlit")
st.write(
"Intro to Streamlit primitives: text, widgets, layout, state via reruns, and a caching preview."
)
st.header("1. Hello + Core Widgets")
name = st.text_input("Your name", "World")
favorite_num = st.slider("Pick a number", 1, 10, 3)
if st.button("Greet"):
st.success(f"Hello, {name or 'friend'}! Your number squared is {favorite_num ** 2}.")
Now launch the app from your terminal:
$ streamlit run lesson1_main.py
Once the app opens in your browser (by default at http://localhost:8501), you’ll see a text input, a slider, and a button that responds interactively when clicked.
How It Works
Let’s break it down step-by-step:
st.set_page_config: defines global app settings such as title and layout before any element renders.st.titleandst.write: are your simplest text outputs — headers, markdown, and general content.st.text_inputandst.slider: return user-controlled values every time the script reruns.st.button: acts as a short-lived trigger — it’s True only on the exact rerun when clicked.st.success: displays a styled success message dynamically based on user input.
Each time you type in the text box, move the slider, or press the button, Streamlit automatically reruns the entire script from top to bottom.
However, widget values persist across reruns, allowing your app to behave reactively while staying stateless in code.
Expanding the App: Dataset Preview + Widget Playground
Now that you’ve seen basic widgets in action, let’s expand our app to include data interaction and additional UI elements.
Update your lesson1_main.py with the following code:
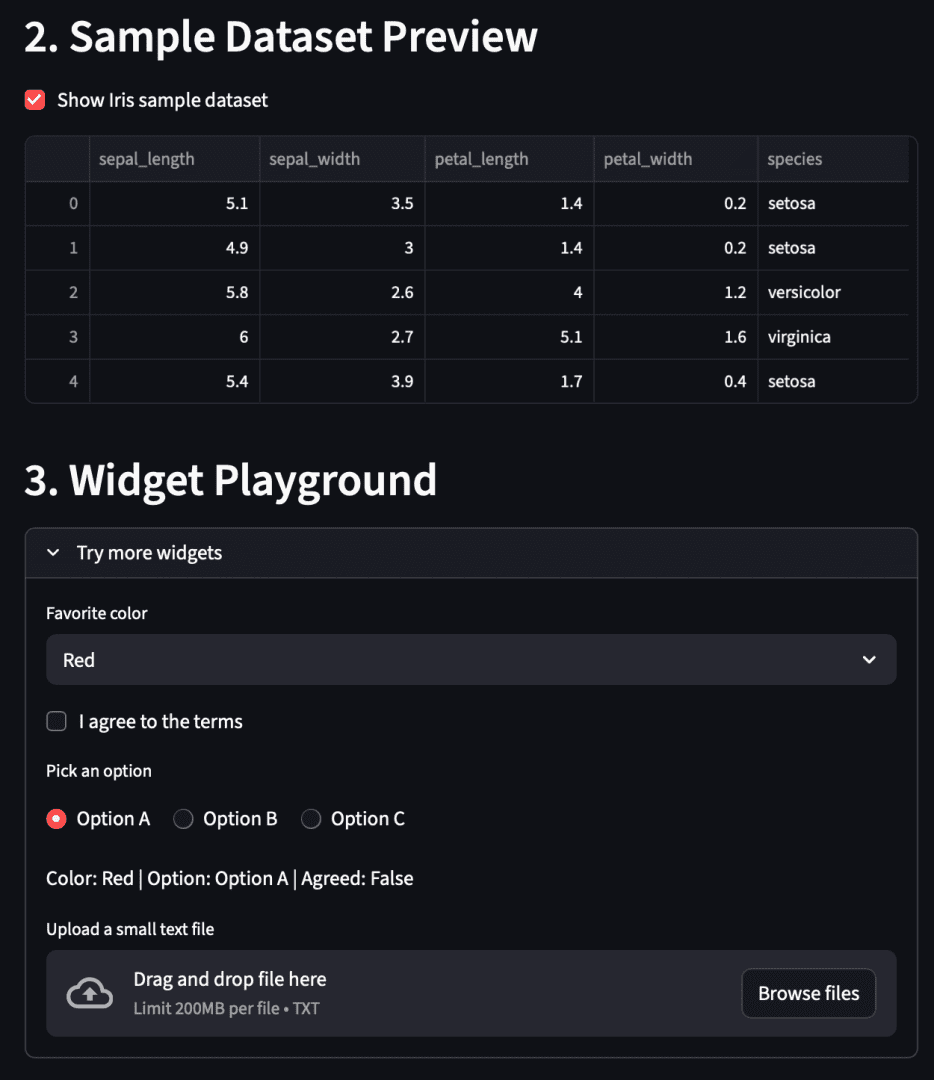
st.header("2. Sample Dataset Preview")

show_df = st.checkbox("Show Iris sample dataset", value=True)
if show_df:
    df = load_iris_sample(settings.default_sample_path)
    st.dataframe(df.head())
else:
    df = None  # type: ignore

st.header("3. Widget Playground")
with st.expander("Try more widgets", expanded=False):
    color = st.selectbox("Favorite color", ["Red", "Green", "Blue"])
    agree = st.checkbox("I agree to the terms")
    option = st.radio("Pick an option", ["Option A", "Option B", "Option C"], horizontal=True)
    st.write(f"Color: {color} | Option: {option} | Agreed: {agree}")

    uploaded = st.file_uploader("Upload a small text file", type=["txt"])
    if uploaded:
        st.code(uploaded.read().decode("utf-8")[:500])
What’s Happening Here
Let’s unpack the new sections:
- Dataset preview:
- The Iris dataset is stored in
data/iris_sample.csv. load_iris_sample()(defined inpyimagesearch/data_loader.py) usespandas.read_csv()wrapped with@lru_cache(maxsize=1).- This means the file is read from disk only once — future reruns reuse the cached DataFrame, keeping the app snappy.
- The Iris dataset is stored in
- Checkbox toggle:
- When “Show Iris sample dataset” is checked, the DataFrame appears; unchecking hides it.
- This pattern introduces conditional rendering — one of the simplest ways to make your app dynamic.
- Expander widget group:
- The
st.expanderacts like a collapsible section — perfect for hiding optional controls. - Inside, you experiment with selectbox, checkbox, and radio widgets.
- The
st.file_uploaderlets you upload small text files. Once uploaded, the app reads the contents, decodes them, and displays the first 500 characters.
- The
Together, this demonstrates how Streamlit keeps your app interactive and stateful — even though your script is still running top to bottom on each user action.
Structuring Your Layout: Columns + Metrics
Streamlit makes it easy to organize information visually using columns, sidebars, and metrics — all without touching HTML or CSS.
Let’s add a simple layout section that displays dynamic statistics from your Iris dataset and user inputs.
Append this block to your existing script:
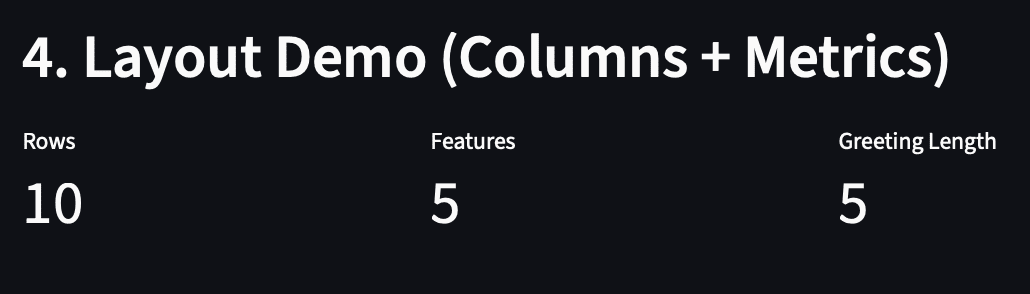
st.header("4. Layout Demo (Columns + Metrics)")

col1, col2, col3 = st.columns(3)

with col1:
    st.metric("Rows", len(df) if df is not None else 0)
with col2:
    st.metric("Features", 5 if df is not None else 0)
with col3:
    st.metric("Greeting Length", len(name))
Understanding Columns and Metrics
st.columns(3): divides the page into three equal-width containers.
Each container (col1,col2,col3) acts like a mini layout context.
Widgets and text added inside each context appear side-by-side rather than stacked vertically.st.metric(label, value): displays a clean, compact key-value card often used for key performance indicators (e.g., totals, averages, growth rates).
You can also add a third “delta” argument (e.g.,st.metric("Sales", 100, "+5%")) to show performance trends — we’ll revisit that in Lesson 2 when visualizing data.
In this example:
- The
Rowscount shows how many records the Iris DataFrame contains. Featuresrepresents the number of columns (hardcoded to5here).Greeting Lengthdemonstrates how you can dynamically compute a small metric from user input (len(name)).
This compact summary layout gives your app a dashboard-like look — perfect for reporting small insights without cluttering the interface.
Speeding Things Up with Caching (@st.cache_data)
Every time a user interacts with a widget, Streamlit reruns the entire script from top to bottom.
That’s what keeps apps reactive, but it also means any heavy computations will be repeated unnecessarily.
To fix that, Streamlit provides a lightweight caching system using decorators such as @st.cache_data.
Add this final block to your script:
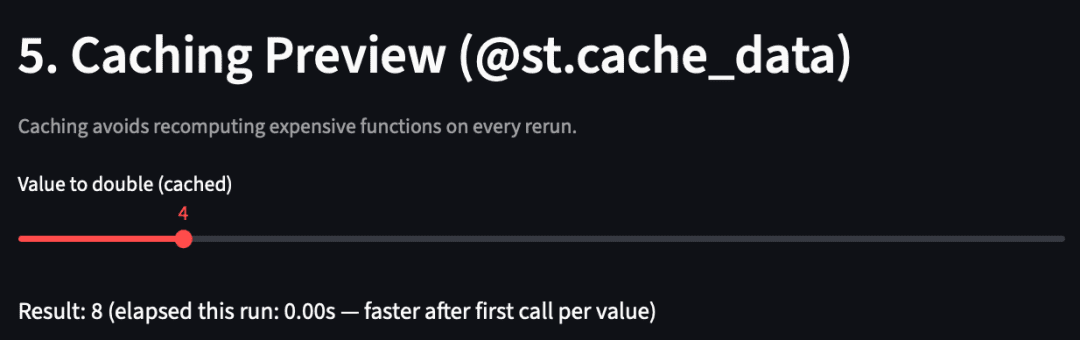
st.header("5. Caching Preview (@st.cache_data)")
st.caption("Caching avoids recomputing expensive functions on every rerun.")

@st.cache_data
def expensive_double(n: int) -> int:
    time.sleep(1.5)  # simulate expensive work
    return n * 2

val = st.slider("Value to double (cached)", 1, 20, 4, key="cache_slider")

start = time.time()
result = expensive_double(val)
elapsed = time.time() - start

st.write(f"Result: {result} (elapsed this run: {elapsed:.2f}s - faster after first call per value)")
How Caching Works
When you decorate a function with @st.cache_data, Streamlit remembers its inputs and outputs.
If the same input appears again, Streamlit skips re-execution and returns the cached result immediately.
Here’s what happens in this example:
- You move the slider to a new number — Streamlit reruns the script.
- The function
expensive_double()checks whether that number (n) has been computed before. - If not, it waits 1.5 seconds (simulating a costly task) and saves the result.
- The next time you select the same number, it returns immediately — no delay, no recomputation.
Caching is critical once your app connects to databases or runs inference on ML models.
By avoiding redundant work, it keeps the user experience snappy and the backend efficient.
What’s next? We recommend PyImageSearch University.
86+ total classes • 115+ hours hours of on-demand code walkthrough videos • Last updated: December 2025
★★★★★ 4.84 (128 Ratings) • 16,000+ Students Enrolled
I strongly believe that if you had the right teacher you could master computer vision and deep learning.
Do you think learning computer vision and deep learning has to be time-consuming, overwhelming, and complicated? Or has to involve complex mathematics and equations? Or requires a degree in computer science?
That’s not the case.
All you need to master computer vision and deep learning is for someone to explain things to you in simple, intuitive terms. And that’s exactly what I do. My mission is to change education and how complex Artificial Intelligence topics are taught.
If you’re serious about learning computer vision, your next stop should be PyImageSearch University, the most comprehensive computer vision, deep learning, and OpenCV course online today. Here you’ll learn how to successfully and confidently apply computer vision to your work, research, and projects. Join me in computer vision mastery.
Inside PyImageSearch University you’ll find:
- ✓ 86+ courses on essential computer vision, deep learning, and OpenCV topics
- ✓ 86 Certificates of Completion
- ✓ 115+ hours hours of on-demand video
- ✓ Brand new courses released regularly, ensuring you can keep up with state-of-the-art techniques
- ✓ Pre-configured Jupyter Notebooks in Google Colab
- ✓ Run all code examples in your web browser — works on Windows, macOS, and Linux (no dev environment configuration required!)
- ✓ Access to centralized code repos for all 540+ tutorials on PyImageSearch
- ✓ Easy one-click downloads for code, datasets, pre-trained models, etc.
- ✓ Access on mobile, laptop, desktop, etc.
Summary
In this first lesson, you built the foundation for the entire Streamlit series. You learned what Streamlit is, how its reactive rerun model works, and how it turns a simple Python script into an interactive web app — without touching HTML, CSS, or JavaScript.
You also:
- Set up a clean project structure with reusable helper modules (
config.py,data_loader.py). - Explored Streamlit’s core widgets (
st.text_input,st.slider,st.button, etc.). - Practiced basic layout patterns using columns.
- Understood how
@st.cache_dataprevents repeated expensive computations. - Saw how each interaction triggers a top-to-bottom rerun while Streamlit automatically remembers widget state.
- Learned best practices for modularity, readability, and caching early on.
In short, you now have the muscle memory to go from a static Python script to a live, reactive UI. Lesson 2 will take these same concepts further — adding navigation, file uploads, visualizations, and real-time data exploration.
Citation Information
Singh, V. “Getting Started with Streamlit: Learn Widgets, Layouts, and Caching,” PyImageSearch, P. Chugh, S. Huot, A. Sharma, and P. Thakur, eds., 2025, https://pyimg.co/zkmrl
@incollection{Singh_2025_Getting-Started-with-Streamlit,
  author = {Vikram Singh},
  title = {{Getting Started with Streamlit: Learn Widgets, Layouts, and Caching}},
  booktitle = {PyImageSearch},
  editor = {Puneet Chugh and Susan Huot and Aditya Sharma and Piyush Thakur},
  year = {2025},
  url = {https://pyimg.co/zkmrl},
}
To download the source code to this post (and be notified when future tutorials are published here on PyImageSearch), simply enter your email address in the form below!

Download the Source Code and FREE 17-page Resource Guide
Enter your email address below to get a .zip of the code and a FREE 17-page Resource Guide on Computer Vision, OpenCV, and Deep Learning. Inside you’ll find my hand-picked tutorials, books, courses, and libraries to help you master CV and DL!
The post Getting Started with Streamlit: Learn Widgets, Layouts, and Caching appeared first on PyImageSearch.